Immigrants from Grenada vs Spanish American Indian 12th Grade, No Diploma
COMPARE
Immigrants from Grenada
Spanish American Indian
12th Grade, No Diploma
12th Grade, No Diploma Comparison
Immigrants from Grenada
Spanish American Indians
88.4%
12TH GRADE, NO DIPLOMA
0.0/ 100
METRIC RATING
292nd/ 347
METRIC RANK
82.9%
12TH GRADE, NO DIPLOMA
0.0/ 100
METRIC RATING
345th/ 347
METRIC RANK
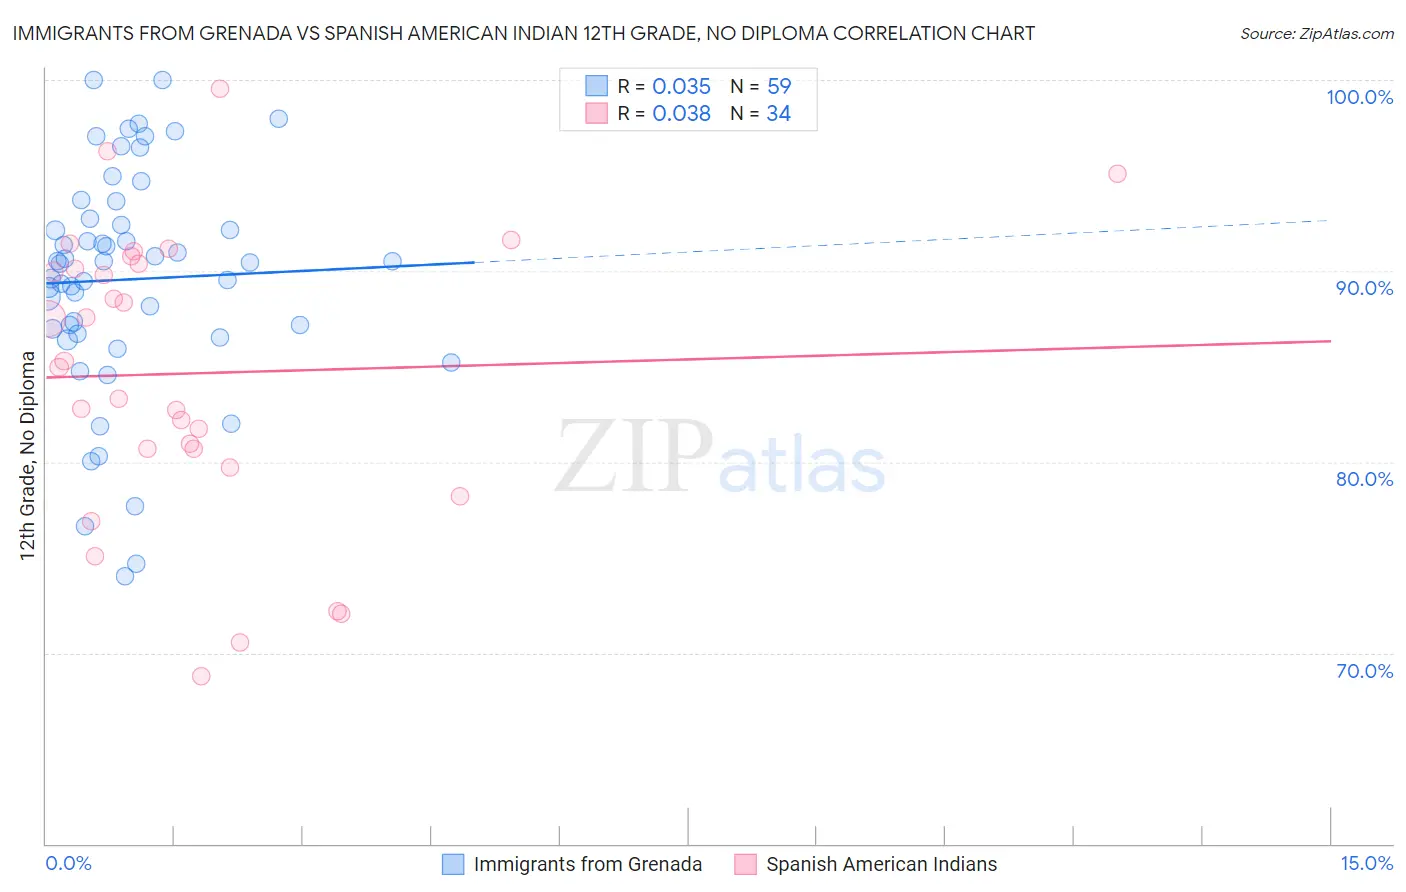
Immigrants from Grenada vs Spanish American Indian 12th Grade, No Diploma Correlation Chart
The statistical analysis conducted on geographies consisting of 67,201,908 people shows no correlation between the proportion of Immigrants from Grenada and percentage of population with at least 12th grade (no diploma) education in the United States with a correlation coefficient (R) of 0.035 and weighted average of 88.4%. Similarly, the statistical analysis conducted on geographies consisting of 73,147,813 people shows no correlation between the proportion of Spanish American Indians and percentage of population with at least 12th grade (no diploma) education in the United States with a correlation coefficient (R) of 0.038 and weighted average of 82.9%, a difference of 6.6%.
12th Grade, No Diploma Correlation Summary
| Measurement | Immigrants from Grenada | Spanish American Indian |
| Minimum | 74.0% | 68.8% |
| Maximum | 100.0% | 99.5% |
| Range | 26.0% | 30.7% |
| Mean | 89.6% | 84.6% |
| Median | 90.4% | 85.1% |
| Interquartile 25% (IQ1) | 86.7% | 80.7% |
| Interquartile 75% (IQ3) | 92.8% | 90.4% |
| Interquartile Range (IQR) | 6.0% | 9.7% |
| Standard Deviation (Sample) | 5.9% | 7.6% |
| Standard Deviation (Population) | 5.9% | 7.5% |
Similar Demographics by 12th Grade, No Diploma
Demographics Similar to Immigrants from Grenada by 12th Grade, No Diploma
In terms of 12th grade, no diploma, the demographic groups most similar to Immigrants from Grenada are Japanese (88.3%, a difference of 0.090%), Guyanese (88.3%, a difference of 0.15%), Dutch West Indian (88.5%, a difference of 0.17%), British West Indian (88.5%, a difference of 0.17%), and Haitian (88.5%, a difference of 0.17%).
| Demographics | Rating | Rank | 12th Grade, No Diploma |
| Indonesians | 0.0 /100 | #285 | Tragic 88.6% |
| Immigrants | West Indies | 0.0 /100 | #286 | Tragic 88.6% |
| Hopi | 0.0 /100 | #287 | Tragic 88.6% |
| Immigrants | Fiji | 0.0 /100 | #288 | Tragic 88.6% |
| Dutch West Indians | 0.0 /100 | #289 | Tragic 88.5% |
| British West Indians | 0.0 /100 | #290 | Tragic 88.5% |
| Haitians | 0.0 /100 | #291 | Tragic 88.5% |
| Immigrants | Grenada | 0.0 /100 | #292 | Tragic 88.4% |
| Japanese | 0.0 /100 | #293 | Tragic 88.3% |
| Guyanese | 0.0 /100 | #294 | Tragic 88.3% |
| Immigrants | Immigrants | 0.0 /100 | #295 | Tragic 88.2% |
| Fijians | 0.0 /100 | #296 | Tragic 88.2% |
| Pueblo | 0.0 /100 | #297 | Tragic 88.2% |
| Immigrants | Haiti | 0.0 /100 | #298 | Tragic 88.2% |
| Nepalese | 0.0 /100 | #299 | Tragic 88.1% |
Demographics Similar to Spanish American Indians by 12th Grade, No Diploma
In terms of 12th grade, no diploma, the demographic groups most similar to Spanish American Indians are Immigrants from Central America (83.0%, a difference of 0.070%), Yakama (82.5%, a difference of 0.53%), Immigrants from Mexico (82.4%, a difference of 0.58%), Immigrants from El Salvador (83.6%, a difference of 0.80%), and Houma (83.7%, a difference of 0.97%).
| Demographics | Rating | Rank | 12th Grade, No Diploma |
| Immigrants | Latin America | 0.0 /100 | #333 | Tragic 85.0% |
| Immigrants | Dominican Republic | 0.0 /100 | #334 | Tragic 84.9% |
| Immigrants | Yemen | 0.0 /100 | #335 | Tragic 84.8% |
| Tohono O'odham | 0.0 /100 | #336 | Tragic 84.7% |
| Pima | 0.0 /100 | #337 | Tragic 84.6% |
| Guatemalans | 0.0 /100 | #338 | Tragic 84.6% |
| Salvadorans | 0.0 /100 | #339 | Tragic 84.5% |
| Mexicans | 0.0 /100 | #340 | Tragic 84.1% |
| Immigrants | Guatemala | 0.0 /100 | #341 | Tragic 84.0% |
| Houma | 0.0 /100 | #342 | Tragic 83.7% |
| Immigrants | El Salvador | 0.0 /100 | #343 | Tragic 83.6% |
| Immigrants | Central America | 0.0 /100 | #344 | Tragic 83.0% |
| Spanish American Indians | 0.0 /100 | #345 | Tragic 82.9% |
| Yakama | 0.0 /100 | #346 | Tragic 82.5% |
| Immigrants | Mexico | 0.0 /100 | #347 | Tragic 82.4% |