Immigrants from Grenada vs Puerto Rican 7th Grade
COMPARE
Immigrants from Grenada
Puerto Rican
7th Grade
7th Grade Comparison
Immigrants from Grenada
Puerto Ricans
94.8%
7TH GRADE
0.0/ 100
METRIC RATING
291st/ 347
METRIC RANK
94.0%
7TH GRADE
0.0/ 100
METRIC RATING
311th/ 347
METRIC RANK
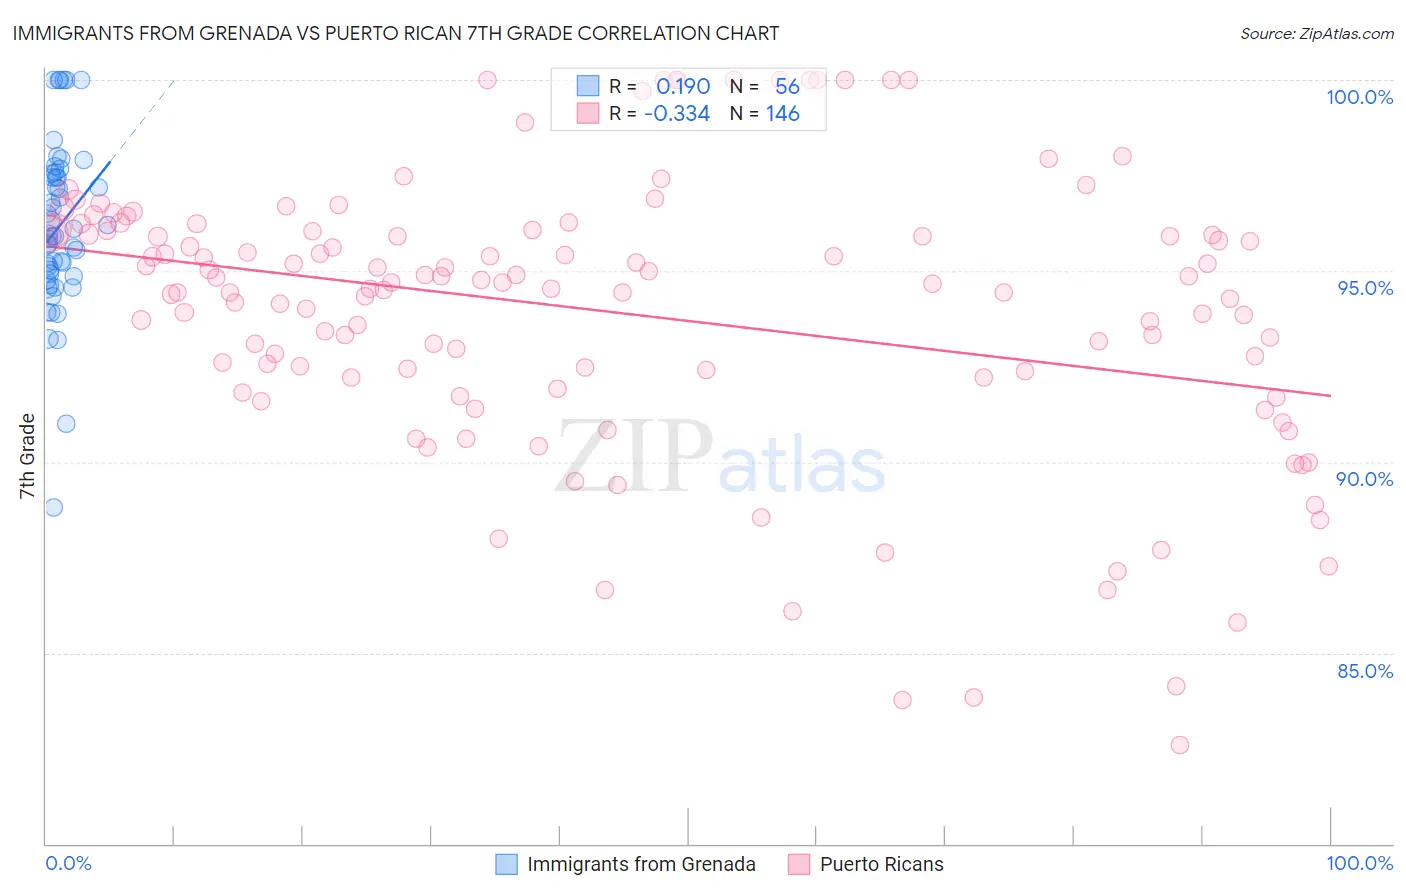
Immigrants from Grenada vs Puerto Rican 7th Grade Correlation Chart
The statistical analysis conducted on geographies consisting of 67,191,509 people shows a poor positive correlation between the proportion of Immigrants from Grenada and percentage of population with at least 7th grade education in the United States with a correlation coefficient (R) of 0.190 and weighted average of 94.8%. Similarly, the statistical analysis conducted on geographies consisting of 528,319,832 people shows a mild negative correlation between the proportion of Puerto Ricans and percentage of population with at least 7th grade education in the United States with a correlation coefficient (R) of -0.334 and weighted average of 94.0%, a difference of 0.80%.
7th Grade Correlation Summary
| Measurement | Immigrants from Grenada | Puerto Rican |
| Minimum | 88.8% | 82.6% |
| Maximum | 100.0% | 100.0% |
| Range | 11.2% | 17.4% |
| Mean | 96.2% | 93.9% |
| Median | 95.9% | 94.6% |
| Interquartile 25% (IQ1) | 94.9% | 92.2% |
| Interquartile 75% (IQ3) | 97.5% | 96.0% |
| Interquartile Range (IQR) | 2.6% | 3.8% |
| Standard Deviation (Sample) | 2.2% | 3.6% |
| Standard Deviation (Population) | 2.2% | 3.6% |
Demographics Similar to Immigrants from Grenada and Puerto Ricans by 7th Grade
In terms of 7th grade, the demographic groups most similar to Immigrants from Grenada are Immigrants from West Indies (94.8%, a difference of 0.020%), Fijian (94.7%, a difference of 0.040%), Haitian (94.7%, a difference of 0.12%), Yaqui (94.6%, a difference of 0.16%), and Cuban (94.6%, a difference of 0.16%). Similarly, the demographic groups most similar to Puerto Ricans are Immigrants from Caribbean (94.0%, a difference of 0.010%), Ecuadorian (94.0%, a difference of 0.020%), Cape Verdean (94.1%, a difference of 0.080%), Immigrants from Portugal (94.2%, a difference of 0.17%), and Immigrants from Guyana (94.2%, a difference of 0.19%).
| Demographics | Rating | Rank | 7th Grade |
| Immigrants | Grenada | 0.0 /100 | #291 | Tragic 94.8% |
| Immigrants | West Indies | 0.0 /100 | #292 | Tragic 94.8% |
| Fijians | 0.0 /100 | #293 | Tragic 94.7% |
| Haitians | 0.0 /100 | #294 | Tragic 94.7% |
| Yaqui | 0.0 /100 | #295 | Tragic 94.6% |
| Cubans | 0.0 /100 | #296 | Tragic 94.6% |
| Immigrants | South Eastern Asia | 0.0 /100 | #297 | Tragic 94.5% |
| Indonesians | 0.0 /100 | #298 | Tragic 94.5% |
| Bangladeshis | 0.0 /100 | #299 | Tragic 94.5% |
| Immigrants | Burma/Myanmar | 0.0 /100 | #300 | Tragic 94.5% |
| Immigrants | Dominica | 0.0 /100 | #301 | Tragic 94.5% |
| Immigrants | Laos | 0.0 /100 | #302 | Tragic 94.5% |
| Sri Lankans | 0.0 /100 | #303 | Tragic 94.4% |
| Immigrants | Haiti | 0.0 /100 | #304 | Tragic 94.3% |
| Guyanese | 0.0 /100 | #305 | Tragic 94.3% |
| Immigrants | Guyana | 0.0 /100 | #306 | Tragic 94.2% |
| Immigrants | Portugal | 0.0 /100 | #307 | Tragic 94.2% |
| Cape Verdeans | 0.0 /100 | #308 | Tragic 94.1% |
| Ecuadorians | 0.0 /100 | #309 | Tragic 94.0% |
| Immigrants | Caribbean | 0.0 /100 | #310 | Tragic 94.0% |
| Puerto Ricans | 0.0 /100 | #311 | Tragic 94.0% |