Immigrants from Greece vs Spanish Associate's Degree
COMPARE
Immigrants from Greece
Spanish
Associate's Degree
Associate's Degree Comparison
Immigrants from Greece
Spanish
52.1%
ASSOCIATE'S DEGREE
99.9/ 100
METRIC RATING
51st/ 347
METRIC RANK
44.4%
ASSOCIATE'S DEGREE
9.4/ 100
METRIC RATING
218th/ 347
METRIC RANK
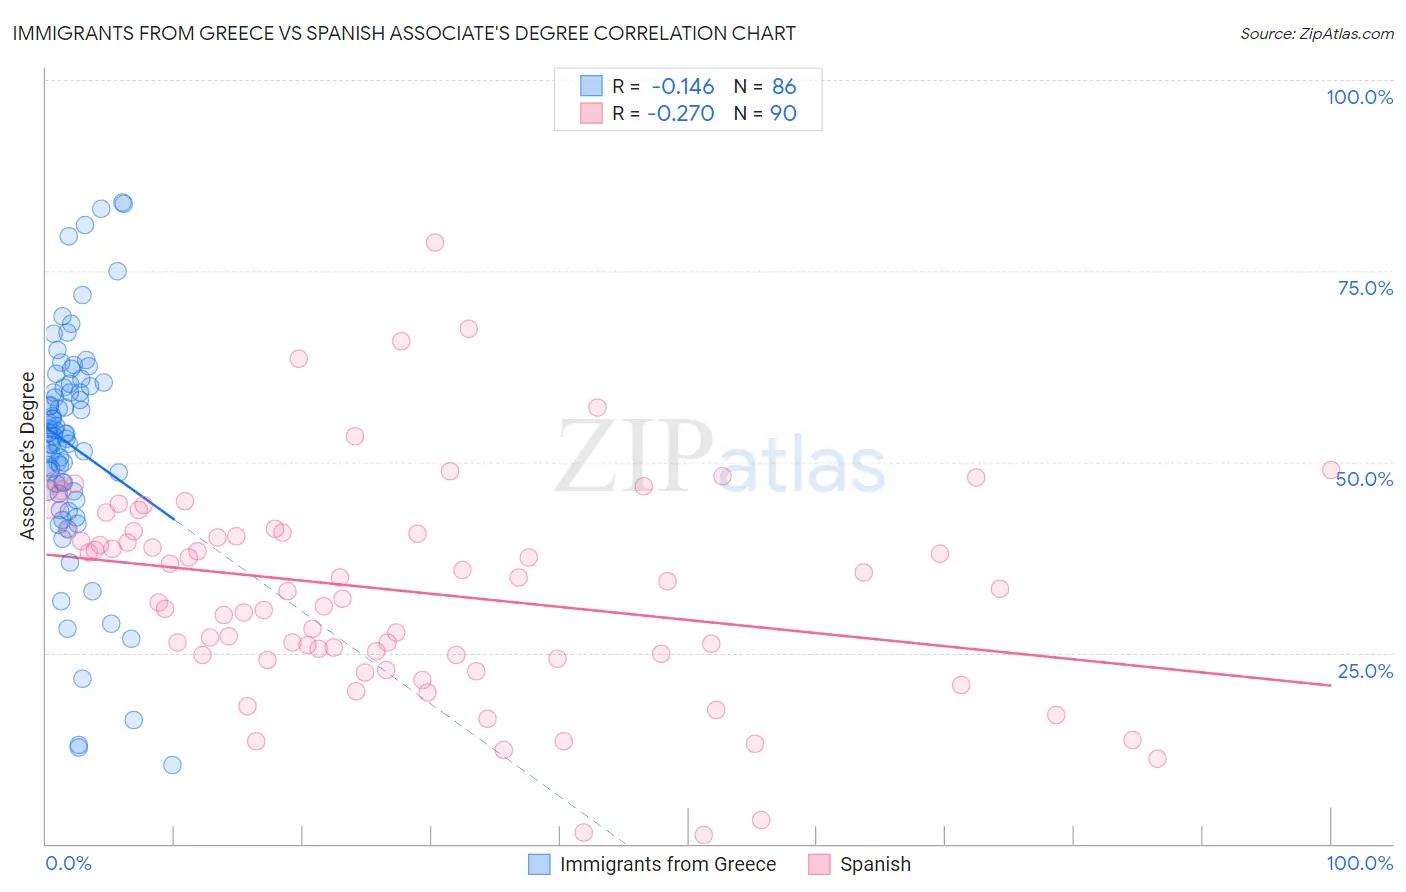
Immigrants from Greece vs Spanish Associate's Degree Correlation Chart
The statistical analysis conducted on geographies consisting of 216,878,450 people shows a poor negative correlation between the proportion of Immigrants from Greece and percentage of population with at least associate's degree education in the United States with a correlation coefficient (R) of -0.146 and weighted average of 52.1%. Similarly, the statistical analysis conducted on geographies consisting of 422,178,546 people shows a weak negative correlation between the proportion of Spanish and percentage of population with at least associate's degree education in the United States with a correlation coefficient (R) of -0.270 and weighted average of 44.4%, a difference of 17.3%.
Associate's Degree Correlation Summary
| Measurement | Immigrants from Greece | Spanish |
| Minimum | 10.3% | 1.2% |
| Maximum | 83.9% | 78.7% |
| Range | 73.6% | 77.5% |
| Mean | 52.1% | 33.1% |
| Median | 53.5% | 33.2% |
| Interquartile 25% (IQ1) | 46.1% | 24.7% |
| Interquartile 75% (IQ3) | 59.9% | 40.9% |
| Interquartile Range (IQR) | 13.8% | 16.2% |
| Standard Deviation (Sample) | 14.9% | 14.1% |
| Standard Deviation (Population) | 14.8% | 14.1% |
Similar Demographics by Associate's Degree
Demographics Similar to Immigrants from Greece by Associate's Degree
In terms of associate's degree, the demographic groups most similar to Immigrants from Greece are Asian (52.1%, a difference of 0.080%), Immigrants from Austria (52.1%, a difference of 0.10%), Bolivian (52.0%, a difference of 0.21%), Immigrants from Asia (52.0%, a difference of 0.23%), and Immigrants from Norway (52.2%, a difference of 0.29%).
| Demographics | Rating | Rank | Associate's Degree |
| Estonians | 99.9 /100 | #44 | Exceptional 52.5% |
| Immigrants | Lithuania | 99.9 /100 | #45 | Exceptional 52.4% |
| Immigrants | Bulgaria | 99.9 /100 | #46 | Exceptional 52.4% |
| Immigrants | Kuwait | 99.9 /100 | #47 | Exceptional 52.4% |
| Immigrants | Norway | 99.9 /100 | #48 | Exceptional 52.2% |
| Immigrants | Austria | 99.9 /100 | #49 | Exceptional 52.1% |
| Asians | 99.9 /100 | #50 | Exceptional 52.1% |
| Immigrants | Greece | 99.9 /100 | #51 | Exceptional 52.1% |
| Bolivians | 99.8 /100 | #52 | Exceptional 52.0% |
| Immigrants | Asia | 99.8 /100 | #53 | Exceptional 52.0% |
| Immigrants | Spain | 99.8 /100 | #54 | Exceptional 51.9% |
| Australians | 99.8 /100 | #55 | Exceptional 51.9% |
| Immigrants | Czechoslovakia | 99.8 /100 | #56 | Exceptional 51.9% |
| Paraguayans | 99.8 /100 | #57 | Exceptional 51.8% |
| New Zealanders | 99.8 /100 | #58 | Exceptional 51.8% |
Demographics Similar to Spanish by Associate's Degree
In terms of associate's degree, the demographic groups most similar to Spanish are Immigrants (44.5%, a difference of 0.25%), Immigrants from Nigeria (44.6%, a difference of 0.43%), White/Caucasian (44.2%, a difference of 0.48%), Portuguese (44.1%, a difference of 0.55%), and Immigrants from Panama (44.7%, a difference of 0.61%).
| Demographics | Rating | Rank | Associate's Degree |
| Immigrants | Zaire | 16.6 /100 | #211 | Poor 45.0% |
| French Canadians | 15.0 /100 | #212 | Poor 44.9% |
| Immigrants | Ghana | 14.2 /100 | #213 | Poor 44.8% |
| Immigrants | Middle Africa | 12.7 /100 | #214 | Poor 44.7% |
| Immigrants | Panama | 12.4 /100 | #215 | Poor 44.7% |
| Immigrants | Nigeria | 11.4 /100 | #216 | Poor 44.6% |
| Immigrants | Immigrants | 10.5 /100 | #217 | Poor 44.5% |
| Spanish | 9.4 /100 | #218 | Tragic 44.4% |
| Whites/Caucasians | 7.5 /100 | #219 | Tragic 44.2% |
| Portuguese | 7.2 /100 | #220 | Tragic 44.1% |
| Immigrants | Western Africa | 6.6 /100 | #221 | Tragic 44.1% |
| Barbadians | 5.8 /100 | #222 | Tragic 43.9% |
| Sub-Saharan Africans | 5.5 /100 | #223 | Tragic 43.9% |
| West Indians | 5.2 /100 | #224 | Tragic 43.8% |
| Guamanians/Chamorros | 4.8 /100 | #225 | Tragic 43.8% |