Immigrants from Greece vs French 5th Grade
COMPARE
Immigrants from Greece
French
5th Grade
5th Grade Comparison
Immigrants from Greece
French
97.5%
5TH GRADE
83.2/ 100
METRIC RATING
144th/ 347
METRIC RANK
98.2%
5TH GRADE
100.0/ 100
METRIC RATING
27th/ 347
METRIC RANK
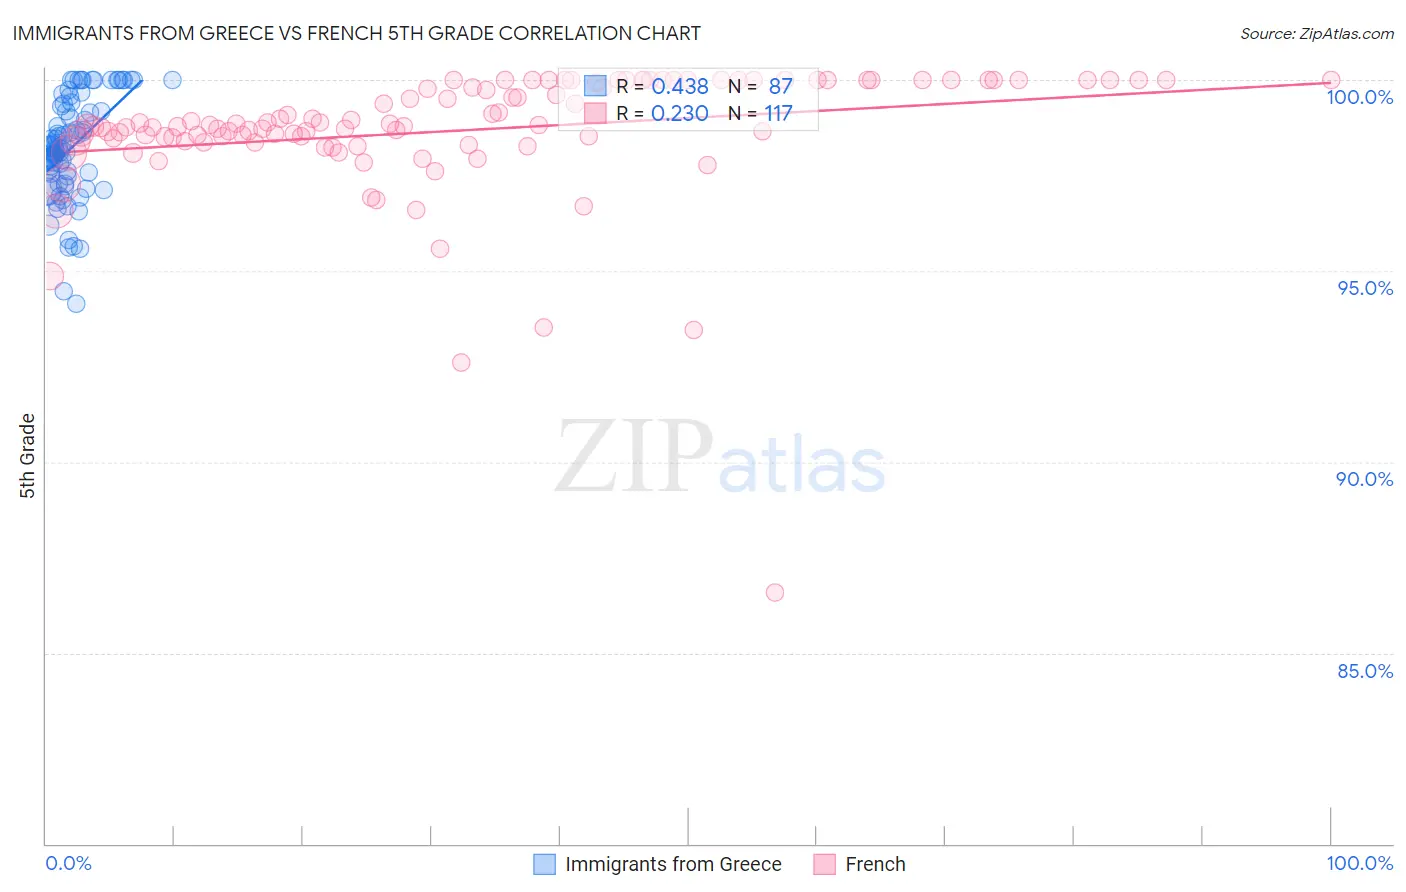
Immigrants from Greece vs French 5th Grade Correlation Chart
The statistical analysis conducted on geographies consisting of 216,879,847 people shows a moderate positive correlation between the proportion of Immigrants from Greece and percentage of population with at least 5th grade education in the United States with a correlation coefficient (R) of 0.438 and weighted average of 97.5%. Similarly, the statistical analysis conducted on geographies consisting of 572,427,255 people shows a weak positive correlation between the proportion of French and percentage of population with at least 5th grade education in the United States with a correlation coefficient (R) of 0.230 and weighted average of 98.2%, a difference of 0.71%.
5th Grade Correlation Summary
| Measurement | Immigrants from Greece | French |
| Minimum | 94.1% | 86.6% |
| Maximum | 100.0% | 100.0% |
| Range | 5.9% | 13.4% |
| Mean | 98.2% | 98.7% |
| Median | 98.2% | 98.8% |
| Interquartile 25% (IQ1) | 97.5% | 98.4% |
| Interquartile 75% (IQ3) | 99.3% | 100.0% |
| Interquartile Range (IQR) | 1.8% | 1.6% |
| Standard Deviation (Sample) | 1.3% | 1.8% |
| Standard Deviation (Population) | 1.3% | 1.7% |
Similar Demographics by 5th Grade
Demographics Similar to Immigrants from Greece by 5th Grade
In terms of 5th grade, the demographic groups most similar to Immigrants from Greece are Jordanian (97.5%, a difference of 0.0%), Spaniard (97.5%, a difference of 0.010%), Soviet Union (97.5%, a difference of 0.010%), Burmese (97.5%, a difference of 0.020%), and Seminole (97.5%, a difference of 0.020%).
| Demographics | Rating | Rank | 5th Grade |
| Filipinos | 86.8 /100 | #137 | Excellent 97.5% |
| Blackfeet | 86.8 /100 | #138 | Excellent 97.5% |
| Immigrants | Turkey | 86.7 /100 | #139 | Excellent 97.5% |
| Burmese | 86.1 /100 | #140 | Excellent 97.5% |
| Seminole | 85.8 /100 | #141 | Excellent 97.5% |
| Israelis | 85.5 /100 | #142 | Excellent 97.5% |
| Immigrants | North Macedonia | 85.4 /100 | #143 | Excellent 97.5% |
| Immigrants | Greece | 83.2 /100 | #144 | Excellent 97.5% |
| Jordanians | 82.6 /100 | #145 | Excellent 97.5% |
| Spaniards | 81.9 /100 | #146 | Excellent 97.5% |
| Soviet Union | 81.2 /100 | #147 | Excellent 97.5% |
| Immigrants | Israel | 79.1 /100 | #148 | Good 97.5% |
| Hopi | 78.6 /100 | #149 | Good 97.5% |
| Immigrants | South Central Asia | 78.6 /100 | #150 | Good 97.5% |
| Immigrants | Eastern Europe | 75.0 /100 | #151 | Good 97.4% |
Demographics Similar to French by 5th Grade
In terms of 5th grade, the demographic groups most similar to French are Czech (98.2%, a difference of 0.0%), Yup'ik (98.2%, a difference of 0.010%), Alaska Native (98.2%, a difference of 0.010%), Scandinavian (98.2%, a difference of 0.010%), and French Canadian (98.2%, a difference of 0.010%).
| Demographics | Rating | Rank | 5th Grade |
| Lithuanians | 100.0 /100 | #20 | Exceptional 98.2% |
| Danes | 100.0 /100 | #21 | Exceptional 98.2% |
| Croatians | 100.0 /100 | #22 | Exceptional 98.2% |
| Sioux | 100.0 /100 | #23 | Exceptional 98.2% |
| Scotch-Irish | 100.0 /100 | #24 | Exceptional 98.2% |
| Yup'ik | 100.0 /100 | #25 | Exceptional 98.2% |
| Alaska Natives | 100.0 /100 | #26 | Exceptional 98.2% |
| French | 100.0 /100 | #27 | Exceptional 98.2% |
| Czechs | 100.0 /100 | #28 | Exceptional 98.2% |
| Scandinavians | 100.0 /100 | #29 | Exceptional 98.2% |
| French Canadians | 100.0 /100 | #30 | Exceptional 98.2% |
| Europeans | 100.0 /100 | #31 | Exceptional 98.2% |
| Chippewa | 100.0 /100 | #32 | Exceptional 98.1% |
| Swiss | 100.0 /100 | #33 | Exceptional 98.1% |
| Chinese | 100.0 /100 | #34 | Exceptional 98.1% |