Immigrants from France vs Osage Doctorate Degree
COMPARE
Immigrants from France
Osage
Doctorate Degree
Doctorate Degree Comparison
Immigrants from France
Osage
2.9%
DOCTORATE DEGREE
100.0/ 100
METRIC RATING
14th/ 347
METRIC RANK
1.7%
DOCTORATE DEGREE
6.5/ 100
METRIC RATING
226th/ 347
METRIC RANK
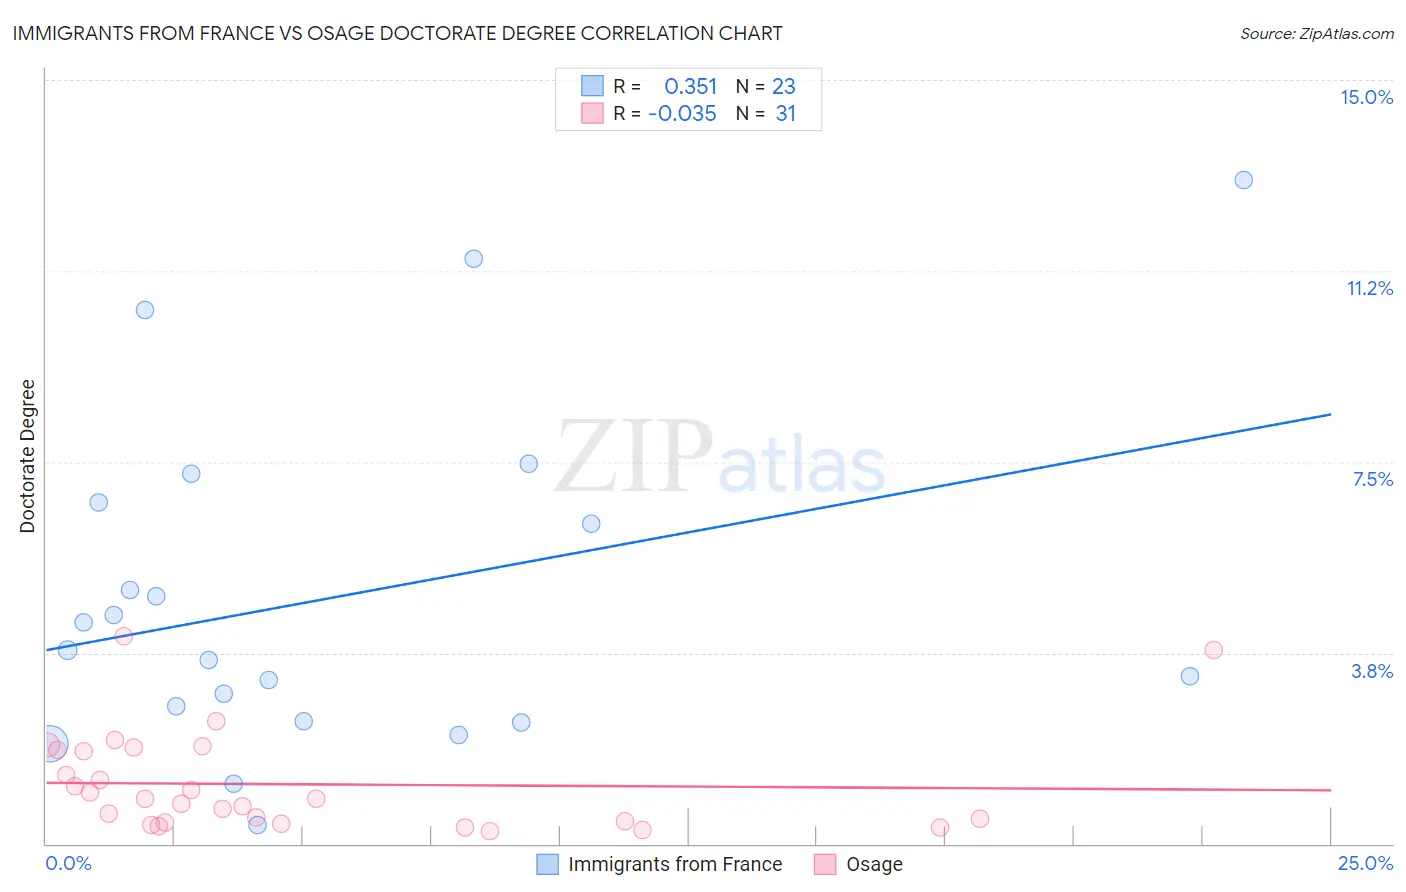
Immigrants from France vs Osage Doctorate Degree Correlation Chart
The statistical analysis conducted on geographies consisting of 286,975,931 people shows a mild positive correlation between the proportion of Immigrants from France and percentage of population with at least doctorate degree education in the United States with a correlation coefficient (R) of 0.351 and weighted average of 2.9%. Similarly, the statistical analysis conducted on geographies consisting of 91,292,964 people shows no correlation between the proportion of Osage and percentage of population with at least doctorate degree education in the United States with a correlation coefficient (R) of -0.035 and weighted average of 1.7%, a difference of 72.6%.
Doctorate Degree Correlation Summary
| Measurement | Immigrants from France | Osage |
| Minimum | 0.38% | 0.25% |
| Maximum | 13.0% | 4.1% |
| Range | 12.7% | 3.8% |
| Mean | 4.8% | 1.2% |
| Median | 3.8% | 0.87% |
| Interquartile 25% (IQ1) | 2.4% | 0.42% |
| Interquartile 75% (IQ3) | 6.7% | 1.9% |
| Interquartile Range (IQR) | 4.3% | 1.4% |
| Standard Deviation (Sample) | 3.3% | 0.97% |
| Standard Deviation (Population) | 3.2% | 0.96% |
Similar Demographics by Doctorate Degree
Demographics Similar to Immigrants from France by Doctorate Degree
In terms of doctorate degree, the demographic groups most similar to Immigrants from France are Immigrants from Sweden (2.9%, a difference of 0.050%), Immigrants from Belgium (2.9%, a difference of 0.99%), Immigrants from India (2.8%, a difference of 1.1%), Eastern European (2.8%, a difference of 1.5%), and Indian (Asian) (2.9%, a difference of 1.7%).
| Demographics | Rating | Rank | Doctorate Degree |
| Immigrants | China | 100.0 /100 | #7 | Exceptional 3.1% |
| Immigrants | Israel | 100.0 /100 | #8 | Exceptional 3.0% |
| Immigrants | Iran | 100.0 /100 | #9 | Exceptional 3.0% |
| Immigrants | Eastern Asia | 100.0 /100 | #10 | Exceptional 3.0% |
| Indians (Asian) | 100.0 /100 | #11 | Exceptional 2.9% |
| Immigrants | Belgium | 100.0 /100 | #12 | Exceptional 2.9% |
| Immigrants | Sweden | 100.0 /100 | #13 | Exceptional 2.9% |
| Immigrants | France | 100.0 /100 | #14 | Exceptional 2.9% |
| Immigrants | India | 100.0 /100 | #15 | Exceptional 2.8% |
| Eastern Europeans | 100.0 /100 | #16 | Exceptional 2.8% |
| Immigrants | Australia | 100.0 /100 | #17 | Exceptional 2.8% |
| Immigrants | Sri Lanka | 100.0 /100 | #18 | Exceptional 2.8% |
| Immigrants | Japan | 100.0 /100 | #19 | Exceptional 2.8% |
| Immigrants | Hong Kong | 100.0 /100 | #20 | Exceptional 2.8% |
| Thais | 100.0 /100 | #21 | Exceptional 2.8% |
Demographics Similar to Osage by Doctorate Degree
In terms of doctorate degree, the demographic groups most similar to Osage are Immigrants from Colombia (1.7%, a difference of 0.12%), Panamanian (1.7%, a difference of 0.14%), Assyrian/Chaldean/Syriac (1.7%, a difference of 0.42%), Immigrants from Poland (1.7%, a difference of 0.61%), and Immigrants from Bosnia and Herzegovina (1.7%, a difference of 0.83%).
| Demographics | Rating | Rank | Doctorate Degree |
| Immigrants | Iraq | 10.7 /100 | #219 | Poor 1.7% |
| Immigrants | Uruguay | 9.2 /100 | #220 | Tragic 1.7% |
| Immigrants | Nonimmigrants | 8.8 /100 | #221 | Tragic 1.7% |
| Immigrants | Venezuela | 8.7 /100 | #222 | Tragic 1.7% |
| Immigrants | Bosnia and Herzegovina | 7.8 /100 | #223 | Tragic 1.7% |
| Immigrants | Poland | 7.4 /100 | #224 | Tragic 1.7% |
| Immigrants | Colombia | 6.7 /100 | #225 | Tragic 1.7% |
| Osage | 6.5 /100 | #226 | Tragic 1.7% |
| Panamanians | 6.3 /100 | #227 | Tragic 1.7% |
| Assyrians/Chaldeans/Syriacs | 5.9 /100 | #228 | Tragic 1.7% |
| Colville | 4.7 /100 | #229 | Tragic 1.6% |
| Immigrants | Philippines | 4.3 /100 | #230 | Tragic 1.6% |
| Immigrants | North Macedonia | 3.9 /100 | #231 | Tragic 1.6% |
| Guamanians/Chamorros | 3.3 /100 | #232 | Tragic 1.6% |
| Barbadians | 3.3 /100 | #233 | Tragic 1.6% |