Immigrants from Europe vs Panamanian Kindergarten

COMPARE

Immigrants from Europe
Race
Ancestry
AfghanAfricanAlaska NativeAlaskan AthabascanAlbanianAleutAlsatianAmericanApacheArabArapahoArgentineanArmenianAssyrian/Chaldean/SyriacAustralianAustrianBahamianBangladeshiBarbadianBasqueBelgianBelizeanBermudanBhutaneseBlackfeetBolivianBrazilianBritishBritish West IndianBulgarianBurmeseCajunCambodianCanadianCape VerdeanCarpatho RusynCelticCentral AmericanCentral American IndianCherokeeCheyenneChickasawChileanChineseChippewaChoctawColombianColvilleComancheCosta RicanCreeCreekCroatianCrowCubanCypriotCzechCzechoslovakianDanishDelawareDominicanDutchDutch West IndianEastern EuropeanEcuadorianEgyptianEnglishEstonianEthiopianEuropeanFijianFilipinoFinnishFrenchFrench American IndianFrench CanadianGermanGerman RussianGhanaianGreekGuamanian/ChamorroGuatemalanGuyaneseHaitianHmongHonduranHopiHoumaHungarianIcelanderIndian (Asian)IndonesianInupiatIranianIraqiIrishIroquoisIsraeliItalianJamaicanJapaneseJordanianKenyanKiowaKoreanLaotianLatvianLebaneseLiberianLithuanianLumbeeLuxembourgerMacedonianMalaysianMalteseMarshalleseMenomineeMexicanMexican American IndianMongolianMoroccanNative HawaiianNavajoNepaleseNew ZealanderNicaraguanNigerianNorthern EuropeanNorwegianOkinawanOsageOttawaPaiutePakistaniPalestinianParaguayanPennsylvania GermanPeruvianPimaPolishPortuguesePotawatomiPuebloPuerto RicanPuget Sound SalishRomanianRussianSalvadoranSamoanScandinavianScotch-IrishScottishSeminoleSenegaleseSerbianShoshoneSierra LeoneanSiouxSlavicSlovakSloveneSomaliSouth AfricanSouth AmericanSouth American IndianSoviet UnionSpaniardSpanishSpanish AmericanSpanish American IndianSri LankanSubsaharan AfricanSudaneseSwedishSwissSyrianTaiwaneseThaiTlingit-HaidaTohono O'OdhamTonganTrinidadian and TobagonianTsimshianTurkishU.S. Virgin IslanderUgandanUkrainianUruguayanUteVenezuelanVietnameseWelshWest IndianYakamaYaquiYugoslavianYumanYup'ikZimbabwean
Immigration
NonimmigrantsImmigrantsAfghanistanAfricaAlbaniaArgentinaArmeniaAsiaAustraliaAustriaBahamasBangladeshBarbadosBelarusBelgiumBelizeBoliviaBosnia and HerzegovinaBrazilBulgariaBurma/MyanmarCabo VerdeCambodiaCameroonCanadaCaribbeanCentral AmericaChileChinaColombiaCongoCosta RicaCroatiaCubaCzechoslovakiaDenmarkDominicaDominican RepublicEastern AfricaEastern AsiaEastern EuropeEcuadorEgyptEl SalvadorEnglandEritreaEthiopiaEuropeFijiFranceGermanyGhanaGreeceGrenadaGuatemalaGuyanaHaitiHondurasHong KongHungaryIndiaIndonesiaIranIraqIrelandIsraelItalyJamaicaJapanJordanKazakhstanKenyaKoreaKuwaitLaosLatin AmericaLatviaLebanonLiberiaLithuaniaMalaysiaMexicoMicronesiaMiddle AfricaMoldovaMoroccoNepalNetherlandsNicaraguaNigeriaNorth AmericaNorth MacedoniaNorthern AfricaNorthern EuropeNorwayOceaniaPakistanPanamaPeruPhilippinesPolandPortugalRomaniaRussiaSaudi ArabiaScotlandSenegalSerbiaSierra LeoneSingaporeSomaliaSouth AfricaSouth AmericaSouth Central AsiaSouth Eastern AsiaSouthern EuropeSpainSri LankaSt. Vincent and the GrenadinesSudanSwedenSwitzerlandSyriaTaiwanThailandTrinidad and TobagoTurkeyUgandaUkraineUruguayUzbekistanVenezuelaVietnamWest IndiesWestern AfricaWestern AsiaWestern EuropeYemenZaireZimbabweAzores
Panamanian
Race
Ancestry
AfghanAfricanAlaska NativeAlaskan AthabascanAlbanianAleutAlsatianAmericanApacheArabArapahoArgentineanArmenianAssyrian/Chaldean/SyriacAustralianAustrianBahamianBangladeshiBarbadianBasqueBelgianBelizeanBermudanBhutaneseBlackfeetBolivianBrazilianBritishBritish West IndianBulgarianBurmeseCajunCambodianCanadianCape VerdeanCarpatho RusynCelticCentral AmericanCentral American IndianCherokeeCheyenneChickasawChileanChineseChippewaChoctawColombianColvilleComancheCosta RicanCreeCreekCroatianCrowCubanCypriotCzechCzechoslovakianDanishDelawareDominicanDutchDutch West IndianEastern EuropeanEcuadorianEgyptianEnglishEstonianEthiopianEuropeanFijianFilipinoFinnishFrenchFrench American IndianFrench CanadianGermanGerman RussianGhanaianGreekGuamanian/ChamorroGuatemalanGuyaneseHaitianHmongHonduranHopiHoumaHungarianIcelanderIndian (Asian)IndonesianInupiatIranianIraqiIrishIroquoisIsraeliItalianJamaicanJapaneseJordanianKenyanKiowaKoreanLaotianLatvianLebaneseLiberianLithuanianLumbeeLuxembourgerMacedonianMalaysianMalteseMarshalleseMenomineeMexicanMexican American IndianMongolianMoroccanNative HawaiianNavajoNepaleseNew ZealanderNicaraguanNigerianNorthern EuropeanNorwegianOkinawanOsageOttawaPaiutePakistaniPalestinianPanamanianParaguayanPennsylvania GermanPeruvianPimaPolishPortuguesePotawatomiPuebloPuerto RicanPuget Sound SalishRomanianRussianSalvadoranSamoanScandinavianScotch-IrishScottishSeminoleSenegaleseSerbianShoshoneSierra LeoneanSiouxSlavicSlovakSloveneSomaliSouth AfricanSouth AmericanSouth American IndianSoviet UnionSpaniardSpanishSpanish AmericanSpanish American IndianSri LankanSubsaharan AfricanSudaneseSwedishSwissSyrianTaiwaneseThaiTlingit-HaidaTohono O'OdhamTonganTrinidadian and TobagonianTsimshianTurkishU.S. Virgin IslanderUgandanUkrainianUruguayanUteVenezuelanVietnameseWelshWest IndianYakamaYaquiYugoslavianYumanYup'ikZimbabwean
Immigration
NonimmigrantsImmigrantsAfghanistanAfricaAlbaniaArgentinaArmeniaAsiaAustraliaAustriaBahamasBangladeshBarbadosBelarusBelgiumBelizeBoliviaBosnia and HerzegovinaBrazilBulgariaBurma/MyanmarCabo VerdeCambodiaCameroonCanadaCaribbeanCentral AmericaChileChinaColombiaCongoCosta RicaCroatiaCubaCzechoslovakiaDenmarkDominicaDominican RepublicEastern AfricaEastern AsiaEastern EuropeEcuadorEgyptEl SalvadorEnglandEritreaEthiopiaFijiFranceGermanyGhanaGreeceGrenadaGuatemalaGuyanaHaitiHondurasHong KongHungaryIndiaIndonesiaIranIraqIrelandIsraelItalyJamaicaJapanJordanKazakhstanKenyaKoreaKuwaitLaosLatin AmericaLatviaLebanonLiberiaLithuaniaMalaysiaMexicoMicronesiaMiddle AfricaMoldovaMoroccoNepalNetherlandsNicaraguaNigeriaNorth AmericaNorth MacedoniaNorthern AfricaNorthern EuropeNorwayOceaniaPakistanPanamaPeruPhilippinesPolandPortugalRomaniaRussiaSaudi ArabiaScotlandSenegalSerbiaSierra LeoneSingaporeSomaliaSouth AfricaSouth AmericaSouth Central AsiaSouth Eastern AsiaSouthern EuropeSpainSri LankaSt. Vincent and the GrenadinesSudanSwedenSwitzerlandSyriaTaiwanThailandTrinidad and TobagoTurkeyUgandaUkraineUruguayUzbekistanVenezuelaVietnamWest IndiesWestern AfricaWestern AsiaWestern EuropeYemenZaireZimbabweAzores
Kindergarten
Income
Poverty
Unemployment
Labor Participation
Family Structure
Vehicle Availability
Education Level
Disability

Kindergarten Comparison

Immigrants from Europe

Panamanians

Exceptional
Fair
98.1%
KINDERGARTEN
90.4/ 100
METRIC RATING
133rd/ 347
METRIC RANK
97.9%
KINDERGARTEN
33.3/ 100
METRIC RATING
190th/ 347
METRIC RANK

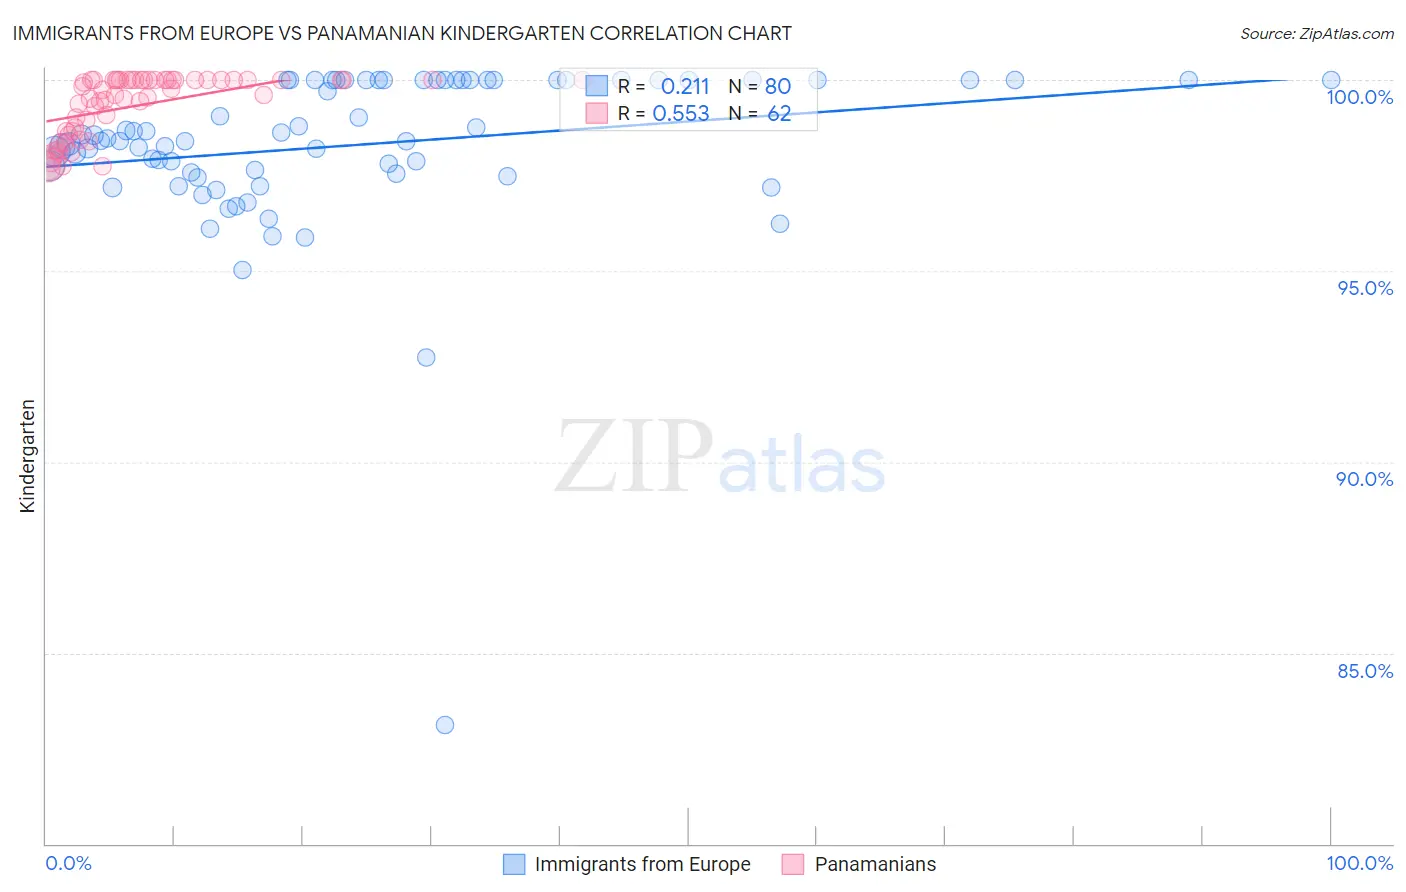
Immigrants from Europe vs Panamanian Kindergarten Correlation Chart

The statistical analysis conducted on geographies consisting of 547,425,973 people shows a weak positive correlation between the proportion of Immigrants from Europe and percentage of population with at least kindergarten education in the United States with a correlation coefficient (R) of 0.211 and weighted average of 98.1%. Similarly, the statistical analysis conducted on geographies consisting of 281,248,945 people shows a substantial positive correlation between the proportion of Panamanians and percentage of population with at least kindergarten education in the United States with a correlation coefficient (R) of 0.553 and weighted average of 97.9%, a difference of 0.23%.
Immigrants from Europe vs Panamanian Kindergarten

Kindergarten Correlation Summary

MeasurementImmigrants from EuropePanamanian
Minimum83.1%97.7%
Maximum100.0%100.0%
Range16.9%2.3%
Mean98.3%99.3%
Median98.4%99.7%
Interquartile 25% (IQ1)97.6%98.7%
Interquartile 75% (IQ3)100.0%100.0%
Interquartile Range (IQR)2.4%1.3%
Standard Deviation (Sample)2.3%0.80%
Standard Deviation (Population)2.2%0.79%

Similar Demographics by Kindergarten

Demographics Similar to Immigrants from Europe by Kindergarten

In terms of kindergarten, the demographic groups most similar to Immigrants from Europe are Seminole (98.1%, a difference of 0.010%), Immigrants from Croatia (98.1%, a difference of 0.010%), Cambodian (98.1%, a difference of 0.010%), Spaniard (98.1%, a difference of 0.010%), and Immigrants from Bulgaria (98.1%, a difference of 0.010%).
DemographicsRating | RankKindergarten
Lebanese
93.5
/100
|
#126
Exceptional
98.2%
Immigrants | Saudi Arabia
93.1
/100
|
#127
Exceptional
98.1%
Immigrants | Serbia
92.4
/100
|
#128
Exceptional
98.1%
Seminole
91.5
/100
|
#129
Exceptional
98.1%
Immigrants | Croatia
91.2
/100
|
#130
Exceptional
98.1%
Cambodians
91.2
/100
|
#131
Exceptional
98.1%
Spaniards
91.0
/100
|
#132
Exceptional
98.1%
Immigrants | Europe
90.4
/100
|
#133
Exceptional
98.1%
Immigrants | Bulgaria
89.4
/100
|
#134
Excellent
98.1%
Immigrants | Kuwait
89.2
/100
|
#135
Excellent
98.1%
Immigrants | Hungary
89.1
/100
|
#136
Excellent
98.1%
Blackfeet
87.8
/100
|
#137
Excellent
98.1%
Immigrants | Romania
87.7
/100
|
#138
Excellent
98.1%
Israelis
87.7
/100
|
#139
Excellent
98.1%
Palestinians
83.6
/100
|
#140
Excellent
98.1%

Demographics Similar to Panamanians by Kindergarten

In terms of kindergarten, the demographic groups most similar to Panamanians are Paiute (97.9%, a difference of 0.0%), Pakistani (97.9%, a difference of 0.010%), Immigrants from Kazakhstan (97.9%, a difference of 0.010%), Arab (97.9%, a difference of 0.010%), and Immigrants from Taiwan (97.9%, a difference of 0.010%).
DemographicsRating | RankKindergarten
Immigrants | Poland
41.4
/100
|
#183
Average
97.9%
Immigrants | Argentina
40.7
/100
|
#184
Average
97.9%
Immigrants | Belarus
39.4
/100
|
#185
Fair
97.9%
Pakistanis
36.0
/100
|
#186
Fair
97.9%
Immigrants | Kazakhstan
35.9
/100
|
#187
Fair
97.9%
Arabs
35.4
/100
|
#188
Fair
97.9%
Paiute
34.7
/100
|
#189
Fair
97.9%
Panamanians
33.3
/100
|
#190
Fair
97.9%
Immigrants | Taiwan
30.7
/100
|
#191
Fair
97.9%
Blacks/African Americans
29.9
/100
|
#192
Fair
97.9%
Paraguayans
29.6
/100
|
#193
Fair
97.9%
Hawaiians
29.3
/100
|
#194
Fair
97.9%
Mongolians
28.9
/100
|
#195
Fair
97.9%
Guamanians/Chamorros
26.2
/100
|
#196
Fair
97.9%
Immigrants | Kenya
25.5
/100
|
#197
Fair
97.9%