Immigrants from Europe vs Immigrants from Middle Africa High School Diploma

COMPARE

Immigrants from Europe
Race
Ancestry
AfghanAfricanAlaska NativeAlaskan AthabascanAlbanianAleutAlsatianAmericanApacheArabArapahoArgentineanArmenianAssyrian/Chaldean/SyriacAustralianAustrianBahamianBangladeshiBarbadianBasqueBelgianBelizeanBermudanBhutaneseBlackfeetBolivianBrazilianBritishBritish West IndianBulgarianBurmeseCajunCambodianCanadianCape VerdeanCarpatho RusynCelticCentral AmericanCentral American IndianCherokeeCheyenneChickasawChileanChineseChippewaChoctawColombianColvilleComancheCosta RicanCreeCreekCroatianCrowCubanCypriotCzechCzechoslovakianDanishDelawareDominicanDutchDutch West IndianEastern EuropeanEcuadorianEgyptianEnglishEstonianEthiopianEuropeanFijianFilipinoFinnishFrenchFrench American IndianFrench CanadianGermanGerman RussianGhanaianGreekGuamanian/ChamorroGuatemalanGuyaneseHaitianHmongHonduranHopiHoumaHungarianIcelanderIndian (Asian)IndonesianInupiatIranianIraqiIrishIroquoisIsraeliItalianJamaicanJapaneseJordanianKenyanKiowaKoreanLaotianLatvianLebaneseLiberianLithuanianLumbeeLuxembourgerMacedonianMalaysianMalteseMarshalleseMenomineeMexicanMexican American IndianMongolianMoroccanNative HawaiianNavajoNepaleseNew ZealanderNicaraguanNigerianNorthern EuropeanNorwegianOkinawanOsageOttawaPaiutePakistaniPalestinianPanamanianParaguayanPennsylvania GermanPeruvianPimaPolishPortuguesePotawatomiPuebloPuerto RicanPuget Sound SalishRomanianRussianSalvadoranSamoanScandinavianScotch-IrishScottishSeminoleSenegaleseSerbianShoshoneSierra LeoneanSiouxSlavicSlovakSloveneSomaliSouth AfricanSouth AmericanSouth American IndianSoviet UnionSpaniardSpanishSpanish AmericanSpanish American IndianSri LankanSubsaharan AfricanSudaneseSwedishSwissSyrianTaiwaneseThaiTlingit-HaidaTohono O'OdhamTonganTrinidadian and TobagonianTsimshianTurkishU.S. Virgin IslanderUgandanUkrainianUruguayanUteVenezuelanVietnameseWelshWest IndianYakamaYaquiYugoslavianYumanYup'ikZimbabwean
Immigration
NonimmigrantsImmigrantsAfghanistanAfricaAlbaniaArgentinaArmeniaAsiaAustraliaAustriaBahamasBangladeshBarbadosBelarusBelgiumBelizeBoliviaBosnia and HerzegovinaBrazilBulgariaBurma/MyanmarCabo VerdeCambodiaCameroonCanadaCaribbeanCentral AmericaChileChinaColombiaCongoCosta RicaCroatiaCubaCzechoslovakiaDenmarkDominicaDominican RepublicEastern AfricaEastern AsiaEastern EuropeEcuadorEgyptEl SalvadorEnglandEritreaEthiopiaEuropeFijiFranceGermanyGhanaGreeceGrenadaGuatemalaGuyanaHaitiHondurasHong KongHungaryIndiaIndonesiaIranIraqIrelandIsraelItalyJamaicaJapanJordanKazakhstanKenyaKoreaKuwaitLaosLatin AmericaLatviaLebanonLiberiaLithuaniaMalaysiaMexicoMicronesiaMoldovaMoroccoNepalNetherlandsNicaraguaNigeriaNorth AmericaNorth MacedoniaNorthern AfricaNorthern EuropeNorwayOceaniaPakistanPanamaPeruPhilippinesPolandPortugalRomaniaRussiaSaudi ArabiaScotlandSenegalSerbiaSierra LeoneSingaporeSomaliaSouth AfricaSouth AmericaSouth Central AsiaSouth Eastern AsiaSouthern EuropeSpainSri LankaSt. Vincent and the GrenadinesSudanSwedenSwitzerlandSyriaTaiwanThailandTrinidad and TobagoTurkeyUgandaUkraineUruguayUzbekistanVenezuelaVietnamWest IndiesWestern AfricaWestern AsiaWestern EuropeYemenZaireZimbabweAzores
Immigrants from Middle Africa
Race
Ancestry
AfghanAfricanAlaska NativeAlaskan AthabascanAlbanianAleutAlsatianAmericanApacheArabArapahoArgentineanArmenianAssyrian/Chaldean/SyriacAustralianAustrianBahamianBangladeshiBarbadianBasqueBelgianBelizeanBermudanBhutaneseBlackfeetBolivianBrazilianBritishBritish West IndianBulgarianBurmeseCajunCambodianCanadianCape VerdeanCarpatho RusynCelticCentral AmericanCentral American IndianCherokeeCheyenneChickasawChileanChineseChippewaChoctawColombianColvilleComancheCosta RicanCreeCreekCroatianCrowCubanCypriotCzechCzechoslovakianDanishDelawareDominicanDutchDutch West IndianEastern EuropeanEcuadorianEgyptianEnglishEstonianEthiopianEuropeanFijianFilipinoFinnishFrenchFrench American IndianFrench CanadianGermanGerman RussianGhanaianGreekGuamanian/ChamorroGuatemalanGuyaneseHaitianHmongHonduranHopiHoumaHungarianIcelanderIndian (Asian)IndonesianInupiatIranianIraqiIrishIroquoisIsraeliItalianJamaicanJapaneseJordanianKenyanKiowaKoreanLaotianLatvianLebaneseLiberianLithuanianLumbeeLuxembourgerMacedonianMalaysianMalteseMarshalleseMenomineeMexicanMexican American IndianMongolianMoroccanNative HawaiianNavajoNepaleseNew ZealanderNicaraguanNigerianNorthern EuropeanNorwegianOkinawanOsageOttawaPaiutePakistaniPalestinianPanamanianParaguayanPennsylvania GermanPeruvianPimaPolishPortuguesePotawatomiPuebloPuerto RicanPuget Sound SalishRomanianRussianSalvadoranSamoanScandinavianScotch-IrishScottishSeminoleSenegaleseSerbianShoshoneSierra LeoneanSiouxSlavicSlovakSloveneSomaliSouth AfricanSouth AmericanSouth American IndianSoviet UnionSpaniardSpanishSpanish AmericanSpanish American IndianSri LankanSubsaharan AfricanSudaneseSwedishSwissSyrianTaiwaneseThaiTlingit-HaidaTohono O'OdhamTonganTrinidadian and TobagonianTsimshianTurkishU.S. Virgin IslanderUgandanUkrainianUruguayanUteVenezuelanVietnameseWelshWest IndianYakamaYaquiYugoslavianYumanYup'ikZimbabwean
Immigration
NonimmigrantsImmigrantsAfghanistanAfricaAlbaniaArgentinaArmeniaAsiaAustraliaAustriaBahamasBangladeshBarbadosBelarusBelgiumBelizeBoliviaBosnia and HerzegovinaBrazilBulgariaBurma/MyanmarCabo VerdeCambodiaCameroonCanadaCaribbeanCentral AmericaChileChinaColombiaCongoCosta RicaCroatiaCubaCzechoslovakiaDenmarkDominicaDominican RepublicEastern AfricaEastern AsiaEastern EuropeEcuadorEgyptEl SalvadorEnglandEritreaEthiopiaFijiFranceGermanyGhanaGreeceGrenadaGuatemalaGuyanaHaitiHondurasHong KongHungaryIndiaIndonesiaIranIraqIrelandIsraelItalyJamaicaJapanJordanKazakhstanKenyaKoreaKuwaitLaosLatin AmericaLatviaLebanonLiberiaLithuaniaMalaysiaMexicoMicronesiaMiddle AfricaMoldovaMoroccoNepalNetherlandsNicaraguaNigeriaNorth AmericaNorth MacedoniaNorthern AfricaNorthern EuropeNorwayOceaniaPakistanPanamaPeruPhilippinesPolandPortugalRomaniaRussiaSaudi ArabiaScotlandSenegalSerbiaSierra LeoneSingaporeSomaliaSouth AfricaSouth AmericaSouth Central AsiaSouth Eastern AsiaSouthern EuropeSpainSri LankaSt. Vincent and the GrenadinesSudanSwedenSwitzerlandSyriaTaiwanThailandTrinidad and TobagoTurkeyUgandaUkraineUruguayUzbekistanVenezuelaVietnamWest IndiesWestern AfricaWestern AsiaWestern EuropeYemenZaireZimbabweAzores
High School Diploma
Income
Poverty
Unemployment
Labor Participation
Family Structure
Vehicle Availability
Education Level
Disability

High School Diploma Comparison

Immigrants from Europe

Immigrants from Middle Africa

Exceptional
Tragic
90.5%
HIGH SCHOOL DIPLOMA
98.2/ 100
METRIC RATING
99th/ 347
METRIC RANK
88.0%
HIGH SCHOOL DIPLOMA
3.4/ 100
METRIC RATING
232nd/ 347
METRIC RANK

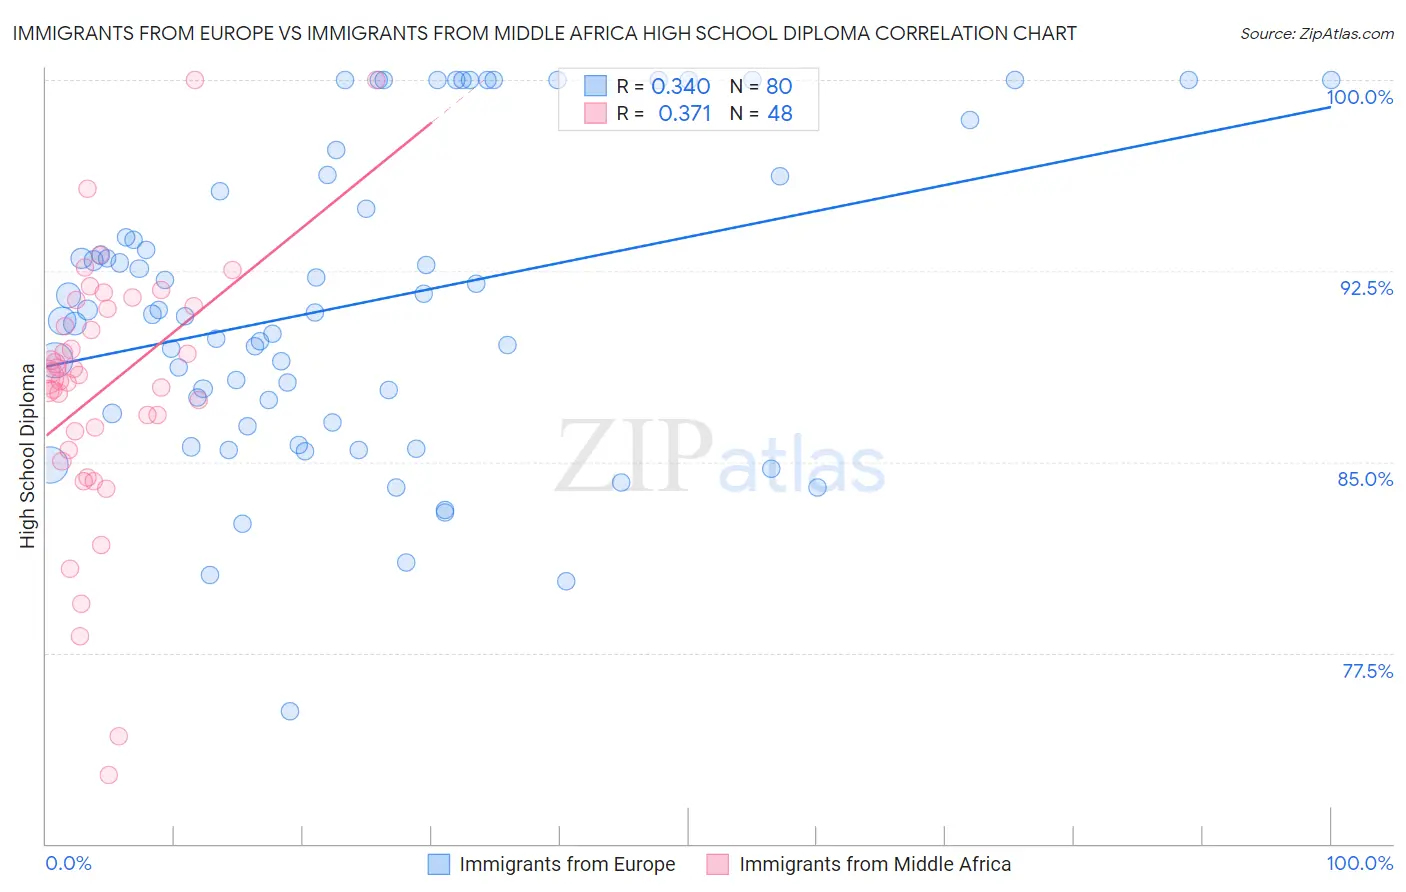
Immigrants from Europe vs Immigrants from Middle Africa High School Diploma Correlation Chart

The statistical analysis conducted on geographies consisting of 547,425,973 people shows a mild positive correlation between the proportion of Immigrants from Europe and percentage of population with at least high school diploma education in the United States with a correlation coefficient (R) of 0.340 and weighted average of 90.5%. Similarly, the statistical analysis conducted on geographies consisting of 202,748,536 people shows a mild positive correlation between the proportion of Immigrants from Middle Africa and percentage of population with at least high school diploma education in the United States with a correlation coefficient (R) of 0.371 and weighted average of 88.0%, a difference of 2.8%.
Immigrants from Europe vs Immigrants from Middle Africa High School Diploma

High School Diploma Correlation Summary

MeasurementImmigrants from EuropeImmigrants from Middle Africa
Minimum75.2%72.7%
Maximum100.0%100.0%
Range24.8%27.3%
Mean91.2%87.9%
Median90.8%88.4%
Interquartile 25% (IQ1)86.7%85.8%
Interquartile 75% (IQ3)95.9%91.1%
Interquartile Range (IQR)9.2%5.2%
Standard Deviation (Sample)6.0%5.2%
Standard Deviation (Population)6.0%5.2%

Similar Demographics by High School Diploma

Demographics Similar to Immigrants from Europe by High School Diploma

In terms of high school diploma, the demographic groups most similar to Immigrants from Europe are Immigrants from North Macedonia (90.5%, a difference of 0.010%), Immigrants from Kuwait (90.5%, a difference of 0.020%), Immigrants from Korea (90.5%, a difference of 0.020%), Immigrants from Norway (90.5%, a difference of 0.030%), and Aleut (90.4%, a difference of 0.040%).
DemographicsRating | RankHigh School Diploma
Swiss
98.6
/100
|
#92
Exceptional
90.6%
Immigrants | Western Europe
98.6
/100
|
#93
Exceptional
90.6%
Immigrants | Israel
98.5
/100
|
#94
Exceptional
90.5%
Icelanders
98.5
/100
|
#95
Exceptional
90.5%
Immigrants | Serbia
98.4
/100
|
#96
Exceptional
90.5%
Immigrants | Kuwait
98.3
/100
|
#97
Exceptional
90.5%
Immigrants | Korea
98.3
/100
|
#98
Exceptional
90.5%
Immigrants | Europe
98.2
/100
|
#99
Exceptional
90.5%
Immigrants | North Macedonia
98.1
/100
|
#100
Exceptional
90.5%
Immigrants | Norway
98.0
/100
|
#101
Exceptional
90.5%
Aleuts
98.0
/100
|
#102
Exceptional
90.4%
Immigrants | Romania
97.8
/100
|
#103
Exceptional
90.4%
Immigrants | Croatia
97.8
/100
|
#104
Exceptional
90.4%
Lebanese
97.4
/100
|
#105
Exceptional
90.4%
Syrians
97.0
/100
|
#106
Exceptional
90.3%

Demographics Similar to Immigrants from Middle Africa by High School Diploma

In terms of high school diploma, the demographic groups most similar to Immigrants from Middle Africa are Immigrants from Panama (88.0%, a difference of 0.040%), Immigrants from Thailand (88.0%, a difference of 0.040%), Colombian (88.1%, a difference of 0.050%), Immigrants from Bahamas (88.0%, a difference of 0.060%), and Subsaharan African (87.9%, a difference of 0.080%).
DemographicsRating | RankHigh School Diploma
Creek
6.9
/100
|
#225
Tragic
88.3%
Uruguayans
5.6
/100
|
#226
Tragic
88.2%
Immigrants | Liberia
5.5
/100
|
#227
Tragic
88.2%
Kiowa
5.3
/100
|
#228
Tragic
88.2%
Nigerians
5.2
/100
|
#229
Tragic
88.2%
Blackfeet
4.2
/100
|
#230
Tragic
88.1%
Colombians
3.8
/100
|
#231
Tragic
88.1%
Immigrants | Middle Africa
3.4
/100
|
#232
Tragic
88.0%
Immigrants | Panama
3.1
/100
|
#233
Tragic
88.0%
Immigrants | Thailand
3.1
/100
|
#234
Tragic
88.0%
Immigrants | Bahamas
2.9
/100
|
#235
Tragic
88.0%
Sub-Saharan Africans
2.8
/100
|
#236
Tragic
87.9%
Taiwanese
2.8
/100
|
#237
Tragic
87.9%
Sioux
2.7
/100
|
#238
Tragic
87.9%
South Americans
2.7
/100
|
#239
Tragic
87.9%