Immigrants from Europe vs Hawaiian 8th Grade

COMPARE

Immigrants from Europe
Race
Ancestry
AfghanAfricanAlaska NativeAlaskan AthabascanAlbanianAleutAlsatianAmericanApacheArabArapahoArgentineanArmenianAssyrian/Chaldean/SyriacAustralianAustrianBahamianBangladeshiBarbadianBasqueBelgianBelizeanBermudanBhutaneseBlackfeetBolivianBrazilianBritishBritish West IndianBulgarianBurmeseCajunCambodianCanadianCape VerdeanCarpatho RusynCelticCentral AmericanCentral American IndianCherokeeCheyenneChickasawChileanChineseChippewaChoctawColombianColvilleComancheCosta RicanCreeCreekCroatianCrowCubanCypriotCzechCzechoslovakianDanishDelawareDominicanDutchDutch West IndianEastern EuropeanEcuadorianEgyptianEnglishEstonianEthiopianEuropeanFijianFilipinoFinnishFrenchFrench American IndianFrench CanadianGermanGerman RussianGhanaianGreekGuamanian/ChamorroGuatemalanGuyaneseHaitianHmongHonduranHopiHoumaHungarianIcelanderIndian (Asian)IndonesianInupiatIranianIraqiIrishIroquoisIsraeliItalianJamaicanJapaneseJordanianKenyanKiowaKoreanLaotianLatvianLebaneseLiberianLithuanianLumbeeLuxembourgerMacedonianMalaysianMalteseMarshalleseMenomineeMexicanMexican American IndianMongolianMoroccanNative HawaiianNavajoNepaleseNew ZealanderNicaraguanNigerianNorthern EuropeanNorwegianOkinawanOsageOttawaPaiutePakistaniPalestinianPanamanianParaguayanPennsylvania GermanPeruvianPimaPolishPortuguesePotawatomiPuebloPuerto RicanPuget Sound SalishRomanianRussianSalvadoranSamoanScandinavianScotch-IrishScottishSeminoleSenegaleseSerbianShoshoneSierra LeoneanSiouxSlavicSlovakSloveneSomaliSouth AfricanSouth AmericanSouth American IndianSoviet UnionSpaniardSpanishSpanish AmericanSpanish American IndianSri LankanSubsaharan AfricanSudaneseSwedishSwissSyrianTaiwaneseThaiTlingit-HaidaTohono O'OdhamTonganTrinidadian and TobagonianTsimshianTurkishU.S. Virgin IslanderUgandanUkrainianUruguayanUteVenezuelanVietnameseWelshWest IndianYakamaYaquiYugoslavianYumanYup'ikZimbabwean
Immigration
NonimmigrantsImmigrantsAfghanistanAfricaAlbaniaArgentinaArmeniaAsiaAustraliaAustriaBahamasBangladeshBarbadosBelarusBelgiumBelizeBoliviaBosnia and HerzegovinaBrazilBulgariaBurma/MyanmarCabo VerdeCambodiaCameroonCanadaCaribbeanCentral AmericaChileChinaColombiaCongoCosta RicaCroatiaCubaCzechoslovakiaDenmarkDominicaDominican RepublicEastern AfricaEastern AsiaEastern EuropeEcuadorEgyptEl SalvadorEnglandEritreaEthiopiaEuropeFijiFranceGermanyGhanaGreeceGrenadaGuatemalaGuyanaHaitiHondurasHong KongHungaryIndiaIndonesiaIranIraqIrelandIsraelItalyJamaicaJapanJordanKazakhstanKenyaKoreaKuwaitLaosLatin AmericaLatviaLebanonLiberiaLithuaniaMalaysiaMexicoMicronesiaMiddle AfricaMoldovaMoroccoNepalNetherlandsNicaraguaNigeriaNorth AmericaNorth MacedoniaNorthern AfricaNorthern EuropeNorwayOceaniaPakistanPanamaPeruPhilippinesPolandPortugalRomaniaRussiaSaudi ArabiaScotlandSenegalSerbiaSierra LeoneSingaporeSomaliaSouth AfricaSouth AmericaSouth Central AsiaSouth Eastern AsiaSouthern EuropeSpainSri LankaSt. Vincent and the GrenadinesSudanSwedenSwitzerlandSyriaTaiwanThailandTrinidad and TobagoTurkeyUgandaUkraineUruguayUzbekistanVenezuelaVietnamWest IndiesWestern AfricaWestern AsiaWestern EuropeYemenZaireZimbabweAzores
Hawaiian
Race
Ancestry
AfghanAfricanAlaska NativeAlaskan AthabascanAlbanianAleutAlsatianAmericanApacheArabArapahoArgentineanArmenianAssyrian/Chaldean/SyriacAustralianAustrianBahamianBangladeshiBarbadianBasqueBelgianBelizeanBermudanBhutaneseBlackfeetBolivianBrazilianBritishBritish West IndianBulgarianBurmeseCajunCambodianCanadianCape VerdeanCarpatho RusynCelticCentral AmericanCentral American IndianCherokeeCheyenneChickasawChileanChineseChippewaChoctawColombianColvilleComancheCosta RicanCreeCreekCroatianCrowCubanCypriotCzechCzechoslovakianDanishDelawareDominicanDutchDutch West IndianEastern EuropeanEcuadorianEgyptianEnglishEstonianEthiopianEuropeanFijianFilipinoFinnishFrenchFrench American IndianFrench CanadianGermanGerman RussianGhanaianGreekGuamanian/ChamorroGuatemalanGuyaneseHaitianHmongHonduranHopiHoumaHungarianIcelanderIndian (Asian)IndonesianInupiatIranianIraqiIrishIroquoisIsraeliItalianJamaicanJapaneseJordanianKenyanKiowaKoreanLaotianLatvianLebaneseLiberianLithuanianLumbeeLuxembourgerMacedonianMalaysianMalteseMarshalleseMenomineeMexicanMexican American IndianMongolianMoroccanNative HawaiianNavajoNepaleseNew ZealanderNicaraguanNigerianNorthern EuropeanNorwegianOkinawanOsageOttawaPaiutePakistaniPalestinianPanamanianParaguayanPennsylvania GermanPeruvianPimaPolishPortuguesePotawatomiPuebloPuerto RicanPuget Sound SalishRomanianRussianSalvadoranSamoanScandinavianScotch-IrishScottishSeminoleSenegaleseSerbianShoshoneSierra LeoneanSiouxSlavicSlovakSloveneSomaliSouth AfricanSouth AmericanSouth American IndianSoviet UnionSpaniardSpanishSpanish AmericanSpanish American IndianSri LankanSubsaharan AfricanSudaneseSwedishSwissSyrianTaiwaneseThaiTlingit-HaidaTohono O'OdhamTonganTrinidadian and TobagonianTsimshianTurkishU.S. Virgin IslanderUgandanUkrainianUruguayanUteVenezuelanVietnameseWelshWest IndianYakamaYaquiYugoslavianYumanYup'ikZimbabwean
Immigration
NonimmigrantsImmigrantsAfghanistanAfricaAlbaniaArgentinaArmeniaAsiaAustraliaAustriaBahamasBangladeshBarbadosBelarusBelgiumBelizeBoliviaBosnia and HerzegovinaBrazilBulgariaBurma/MyanmarCabo VerdeCambodiaCameroonCanadaCaribbeanCentral AmericaChileChinaColombiaCongoCosta RicaCroatiaCubaCzechoslovakiaDenmarkDominicaDominican RepublicEastern AfricaEastern AsiaEastern EuropeEcuadorEgyptEl SalvadorEnglandEritreaEthiopiaFijiFranceGermanyGhanaGreeceGrenadaGuatemalaGuyanaHaitiHondurasHong KongHungaryIndiaIndonesiaIranIraqIrelandIsraelItalyJamaicaJapanJordanKazakhstanKenyaKoreaKuwaitLaosLatin AmericaLatviaLebanonLiberiaLithuaniaMalaysiaMexicoMicronesiaMiddle AfricaMoldovaMoroccoNepalNetherlandsNicaraguaNigeriaNorth AmericaNorth MacedoniaNorthern AfricaNorthern EuropeNorwayOceaniaPakistanPanamaPeruPhilippinesPolandPortugalRomaniaRussiaSaudi ArabiaScotlandSenegalSerbiaSierra LeoneSingaporeSomaliaSouth AfricaSouth AmericaSouth Central AsiaSouth Eastern AsiaSouthern EuropeSpainSri LankaSt. Vincent and the GrenadinesSudanSwedenSwitzerlandSyriaTaiwanThailandTrinidad and TobagoTurkeyUgandaUkraineUruguayUzbekistanVenezuelaVietnamWest IndiesWestern AfricaWestern AsiaWestern EuropeYemenZaireZimbabweAzores
8th Grade
Income
Poverty
Unemployment
Labor Participation
Family Structure
Vehicle Availability
Education Level
Disability

8th Grade Comparison

Immigrants from Europe

Hawaiians

Exceptional
Poor
96.2%
8TH GRADE
95.3/ 100
METRIC RATING
122nd/ 347
METRIC RANK
95.5%
8TH GRADE
16.7/ 100
METRIC RATING
204th/ 347
METRIC RANK

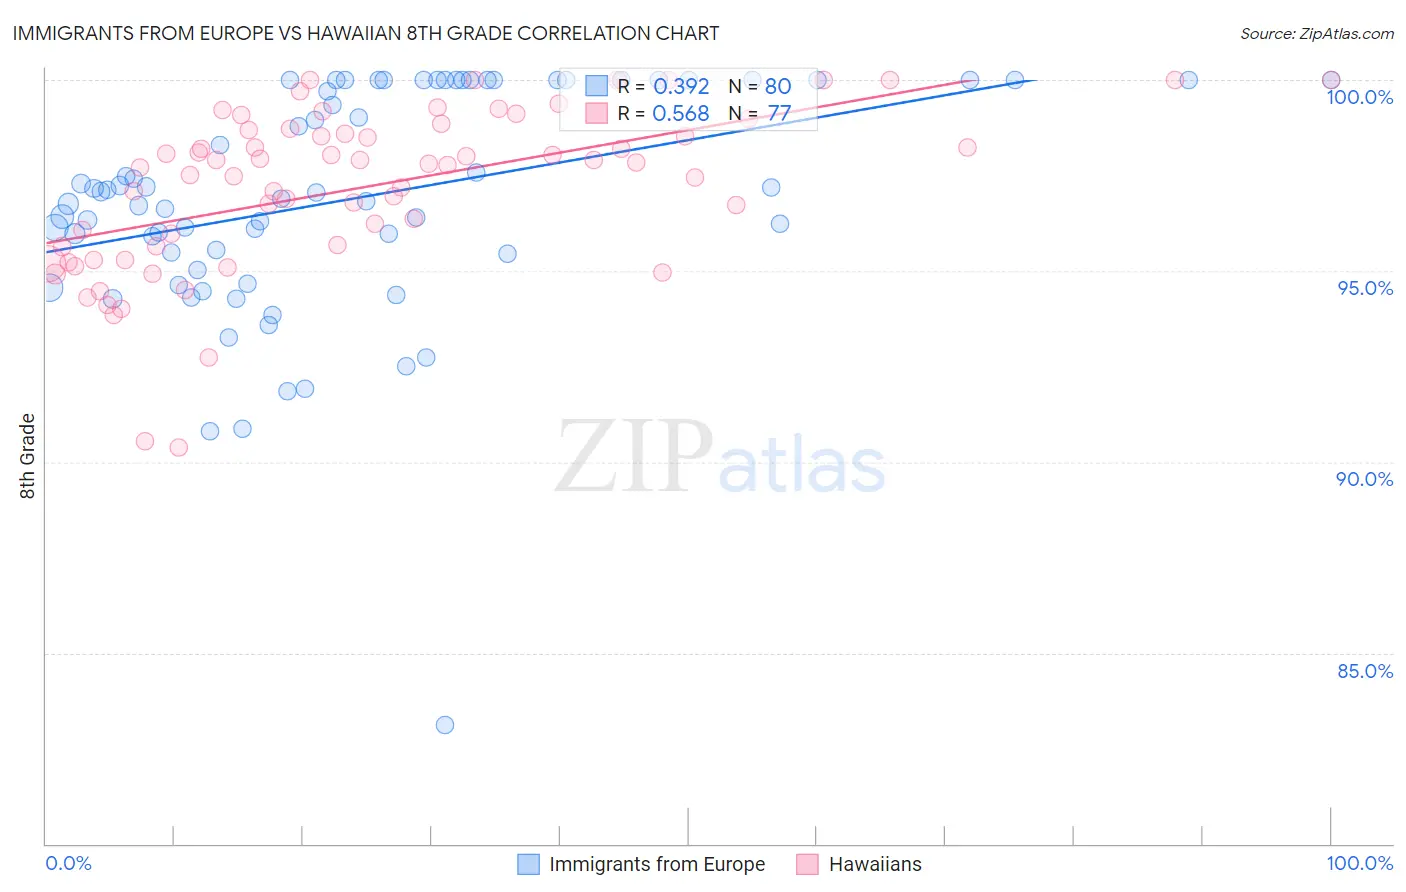
Immigrants from Europe vs Hawaiian 8th Grade Correlation Chart

The statistical analysis conducted on geographies consisting of 547,425,973 people shows a mild positive correlation between the proportion of Immigrants from Europe and percentage of population with at least 8th grade education in the United States with a correlation coefficient (R) of 0.392 and weighted average of 96.2%. Similarly, the statistical analysis conducted on geographies consisting of 327,621,279 people shows a substantial positive correlation between the proportion of Hawaiians and percentage of population with at least 8th grade education in the United States with a correlation coefficient (R) of 0.568 and weighted average of 95.5%, a difference of 0.75%.
Immigrants from Europe vs Hawaiian 8th Grade

8th Grade Correlation Summary

MeasurementImmigrants from EuropeHawaiian
Minimum83.1%90.4%
Maximum100.0%100.0%
Range16.9%9.6%
Mean96.9%97.2%
Median97.1%97.8%
Interquartile 25% (IQ1)95.5%95.6%
Interquartile 75% (IQ3)100.0%98.7%
Interquartile Range (IQR)4.5%3.1%
Standard Deviation (Sample)3.0%2.1%
Standard Deviation (Population)3.0%2.1%

Similar Demographics by 8th Grade

Demographics Similar to Immigrants from Europe by 8th Grade

In terms of 8th grade, the demographic groups most similar to Immigrants from Europe are Immigrants from Switzerland (96.2%, a difference of 0.0%), Immigrants from France (96.2%, a difference of 0.0%), Immigrants from Bulgaria (96.2%, a difference of 0.0%), Immigrants from Norway (96.2%, a difference of 0.020%), and Filipino (96.2%, a difference of 0.020%).
DemographicsRating | Rank8th Grade
Immigrants | Moldova
96.5
/100
|
#115
Exceptional
96.2%
Immigrants | Nonimmigrants
96.0
/100
|
#116
Exceptional
96.2%
Immigrants | Croatia
96.0
/100
|
#117
Exceptional
96.2%
Immigrants | Norway
95.7
/100
|
#118
Exceptional
96.2%
Immigrants | Switzerland
95.3
/100
|
#119
Exceptional
96.2%
Immigrants | France
95.3
/100
|
#120
Exceptional
96.2%
Immigrants | Bulgaria
95.3
/100
|
#121
Exceptional
96.2%
Immigrants | Europe
95.3
/100
|
#122
Exceptional
96.2%
Filipinos
94.6
/100
|
#123
Exceptional
96.2%
Palestinians
94.6
/100
|
#124
Exceptional
96.2%
Immigrants | Romania
94.1
/100
|
#125
Exceptional
96.2%
Choctaw
94.0
/100
|
#126
Exceptional
96.2%
Immigrants | Serbia
94.0
/100
|
#127
Exceptional
96.2%
Immigrants | Bosnia and Herzegovina
93.9
/100
|
#128
Exceptional
96.2%
Cheyenne
93.3
/100
|
#129
Exceptional
96.1%

Demographics Similar to Hawaiians by 8th Grade

In terms of 8th grade, the demographic groups most similar to Hawaiians are Immigrants from Bahamas (95.5%, a difference of 0.0%), Moroccan (95.5%, a difference of 0.010%), Comanche (95.5%, a difference of 0.010%), Immigrants from Sudan (95.5%, a difference of 0.020%), and Apache (95.5%, a difference of 0.030%).
DemographicsRating | Rank8th Grade
Sierra Leoneans
24.3
/100
|
#197
Fair
95.6%
Paraguayans
22.6
/100
|
#198
Fair
95.5%
Immigrants | Northern Africa
22.5
/100
|
#199
Fair
95.5%
Argentineans
22.2
/100
|
#200
Fair
95.5%
Immigrants | Argentina
20.6
/100
|
#201
Fair
95.5%
Apache
19.4
/100
|
#202
Poor
95.5%
Moroccans
17.4
/100
|
#203
Poor
95.5%
Hawaiians
16.7
/100
|
#204
Poor
95.5%
Immigrants | Bahamas
16.7
/100
|
#205
Poor
95.5%
Comanche
16.3
/100
|
#206
Poor
95.5%
Immigrants | Sudan
15.1
/100
|
#207
Poor
95.5%
Portuguese
14.3
/100
|
#208
Poor
95.5%
Immigrants | Lebanon
13.7
/100
|
#209
Poor
95.4%
Africans
13.6
/100
|
#210
Poor
95.4%
Immigrants | Morocco
12.4
/100
|
#211
Poor
95.4%