Immigrants from Ethiopia vs Haitian Professional Degree

COMPARE

Immigrants from Ethiopia
Race
Ancestry
AfghanAfricanAlaska NativeAlaskan AthabascanAlbanianAleutAlsatianAmericanApacheArabArapahoArgentineanArmenianAssyrian/Chaldean/SyriacAustralianAustrianBahamianBangladeshiBarbadianBasqueBelgianBelizeanBermudanBhutaneseBlackfeetBolivianBrazilianBritishBritish West IndianBulgarianBurmeseCajunCambodianCanadianCape VerdeanCarpatho RusynCelticCentral AmericanCentral American IndianCherokeeCheyenneChickasawChileanChineseChippewaChoctawColombianColvilleComancheCosta RicanCreeCreekCroatianCrowCubanCypriotCzechCzechoslovakianDanishDelawareDominicanDutchDutch West IndianEastern EuropeanEcuadorianEgyptianEnglishEstonianEthiopianEuropeanFijianFilipinoFinnishFrenchFrench American IndianFrench CanadianGermanGerman RussianGhanaianGreekGuamanian/ChamorroGuatemalanGuyaneseHmongHonduranHopiHoumaHungarianIcelanderIndian (Asian)IndonesianInupiatIranianIraqiIrishIroquoisIsraeliItalianJamaicanJapaneseJordanianKenyanKiowaKoreanLaotianLatvianLebaneseLiberianLithuanianLumbeeLuxembourgerMacedonianMalaysianMalteseMarshalleseMenomineeMexicanMexican American IndianMongolianMoroccanNative HawaiianNavajoNepaleseNew ZealanderNicaraguanNigerianNorthern EuropeanNorwegianOkinawanOsageOttawaPaiutePakistaniPalestinianPanamanianParaguayanPennsylvania GermanPeruvianPimaPolishPortuguesePotawatomiPuebloPuerto RicanPuget Sound SalishRomanianRussianSalvadoranSamoanScandinavianScotch-IrishScottishSeminoleSenegaleseSerbianShoshoneSierra LeoneanSiouxSlavicSlovakSloveneSomaliSouth AfricanSouth AmericanSouth American IndianSoviet UnionSpaniardSpanishSpanish AmericanSpanish American IndianSri LankanSubsaharan AfricanSudaneseSwedishSwissSyrianTaiwaneseThaiTlingit-HaidaTohono O'OdhamTonganTrinidadian and TobagonianTsimshianTurkishU.S. Virgin IslanderUgandanUkrainianUruguayanUteVenezuelanVietnameseWelshWest IndianYakamaYaquiYugoslavianYumanYup'ikZimbabwean
Immigration
NonimmigrantsImmigrantsAfghanistanAfricaAlbaniaArgentinaArmeniaAsiaAustraliaAustriaBahamasBangladeshBarbadosBelarusBelgiumBelizeBoliviaBosnia and HerzegovinaBrazilBulgariaBurma/MyanmarCabo VerdeCambodiaCameroonCanadaCaribbeanCentral AmericaChileChinaColombiaCongoCosta RicaCroatiaCubaCzechoslovakiaDenmarkDominicaDominican RepublicEastern AfricaEastern AsiaEastern EuropeEcuadorEgyptEl SalvadorEnglandEritreaEthiopiaEuropeFijiFranceGermanyGhanaGreeceGrenadaGuatemalaGuyanaHaitiHondurasHong KongHungaryIndiaIndonesiaIranIraqIrelandIsraelItalyJamaicaJapanJordanKazakhstanKenyaKoreaKuwaitLaosLatin AmericaLatviaLebanonLiberiaLithuaniaMalaysiaMexicoMicronesiaMiddle AfricaMoldovaMoroccoNepalNetherlandsNicaraguaNigeriaNorth AmericaNorth MacedoniaNorthern AfricaNorthern EuropeNorwayOceaniaPakistanPanamaPeruPhilippinesPolandPortugalRomaniaRussiaSaudi ArabiaScotlandSenegalSerbiaSierra LeoneSingaporeSomaliaSouth AfricaSouth AmericaSouth Central AsiaSouth Eastern AsiaSouthern EuropeSpainSri LankaSt. Vincent and the GrenadinesSudanSwedenSwitzerlandSyriaTaiwanThailandTrinidad and TobagoTurkeyUgandaUkraineUruguayUzbekistanVenezuelaVietnamWest IndiesWestern AfricaWestern AsiaWestern EuropeYemenZaireZimbabweAzores
Haitian
Race
Ancestry
AfghanAfricanAlaska NativeAlaskan AthabascanAlbanianAleutAlsatianAmericanApacheArabArapahoArgentineanArmenianAssyrian/Chaldean/SyriacAustralianAustrianBahamianBangladeshiBarbadianBasqueBelgianBelizeanBermudanBhutaneseBlackfeetBolivianBrazilianBritishBritish West IndianBulgarianBurmeseCajunCambodianCanadianCape VerdeanCarpatho RusynCelticCentral AmericanCentral American IndianCherokeeCheyenneChickasawChileanChineseChippewaChoctawColombianColvilleComancheCosta RicanCreeCreekCroatianCrowCubanCypriotCzechCzechoslovakianDanishDelawareDominicanDutchDutch West IndianEastern EuropeanEcuadorianEgyptianEnglishEstonianEthiopianEuropeanFijianFilipinoFinnishFrenchFrench American IndianFrench CanadianGermanGerman RussianGhanaianGreekGuamanian/ChamorroGuatemalanGuyaneseHaitianHmongHonduranHopiHoumaHungarianIcelanderIndian (Asian)IndonesianInupiatIranianIraqiIrishIroquoisIsraeliItalianJamaicanJapaneseJordanianKenyanKiowaKoreanLaotianLatvianLebaneseLiberianLithuanianLumbeeLuxembourgerMacedonianMalaysianMalteseMarshalleseMenomineeMexicanMexican American IndianMongolianMoroccanNative HawaiianNavajoNepaleseNew ZealanderNicaraguanNigerianNorthern EuropeanNorwegianOkinawanOsageOttawaPaiutePakistaniPalestinianPanamanianParaguayanPennsylvania GermanPeruvianPimaPolishPortuguesePotawatomiPuebloPuerto RicanPuget Sound SalishRomanianRussianSalvadoranSamoanScandinavianScotch-IrishScottishSeminoleSenegaleseSerbianShoshoneSierra LeoneanSiouxSlavicSlovakSloveneSomaliSouth AfricanSouth AmericanSouth American IndianSoviet UnionSpaniardSpanishSpanish AmericanSpanish American IndianSri LankanSubsaharan AfricanSudaneseSwedishSwissSyrianTaiwaneseThaiTlingit-HaidaTohono O'OdhamTonganTrinidadian and TobagonianTsimshianTurkishU.S. Virgin IslanderUgandanUkrainianUruguayanUteVenezuelanVietnameseWelshWest IndianYakamaYaquiYugoslavianYumanYup'ikZimbabwean
Immigration
NonimmigrantsImmigrantsAfghanistanAfricaAlbaniaArgentinaArmeniaAsiaAustraliaAustriaBahamasBangladeshBarbadosBelarusBelgiumBelizeBoliviaBosnia and HerzegovinaBrazilBulgariaBurma/MyanmarCabo VerdeCambodiaCameroonCanadaCaribbeanCentral AmericaChileChinaColombiaCongoCosta RicaCroatiaCubaCzechoslovakiaDenmarkDominicaDominican RepublicEastern AfricaEastern AsiaEastern EuropeEcuadorEgyptEl SalvadorEnglandEritreaEuropeFijiFranceGermanyGhanaGreeceGrenadaGuatemalaGuyanaHaitiHondurasHong KongHungaryIndiaIndonesiaIranIraqIrelandIsraelItalyJamaicaJapanJordanKazakhstanKenyaKoreaKuwaitLaosLatin AmericaLatviaLebanonLiberiaLithuaniaMalaysiaMexicoMicronesiaMiddle AfricaMoldovaMoroccoNepalNetherlandsNicaraguaNigeriaNorth AmericaNorth MacedoniaNorthern AfricaNorthern EuropeNorwayOceaniaPakistanPanamaPeruPhilippinesPolandPortugalRomaniaRussiaSaudi ArabiaScotlandSenegalSerbiaSierra LeoneSingaporeSomaliaSouth AfricaSouth AmericaSouth Central AsiaSouth Eastern AsiaSouthern EuropeSpainSri LankaSt. Vincent and the GrenadinesSudanSwedenSwitzerlandSyriaTaiwanThailandTrinidad and TobagoTurkeyUgandaUkraineUruguayUzbekistanVenezuelaVietnamWest IndiesWestern AfricaWestern AsiaWestern EuropeYemenZaireZimbabweAzores
Professional Degree
Income
Poverty
Unemployment
Labor Participation
Family Structure
Vehicle Availability
Education Level
Disability

Professional Degree Comparison

Immigrants from Ethiopia

Haitians

Exceptional
Tragic
5.3%
PROFESSIONAL DEGREE
99.7/ 100
METRIC RATING
77th/ 347
METRIC RANK
3.5%
PROFESSIONAL DEGREE
0.3/ 100
METRIC RATING
286th/ 347
METRIC RANK

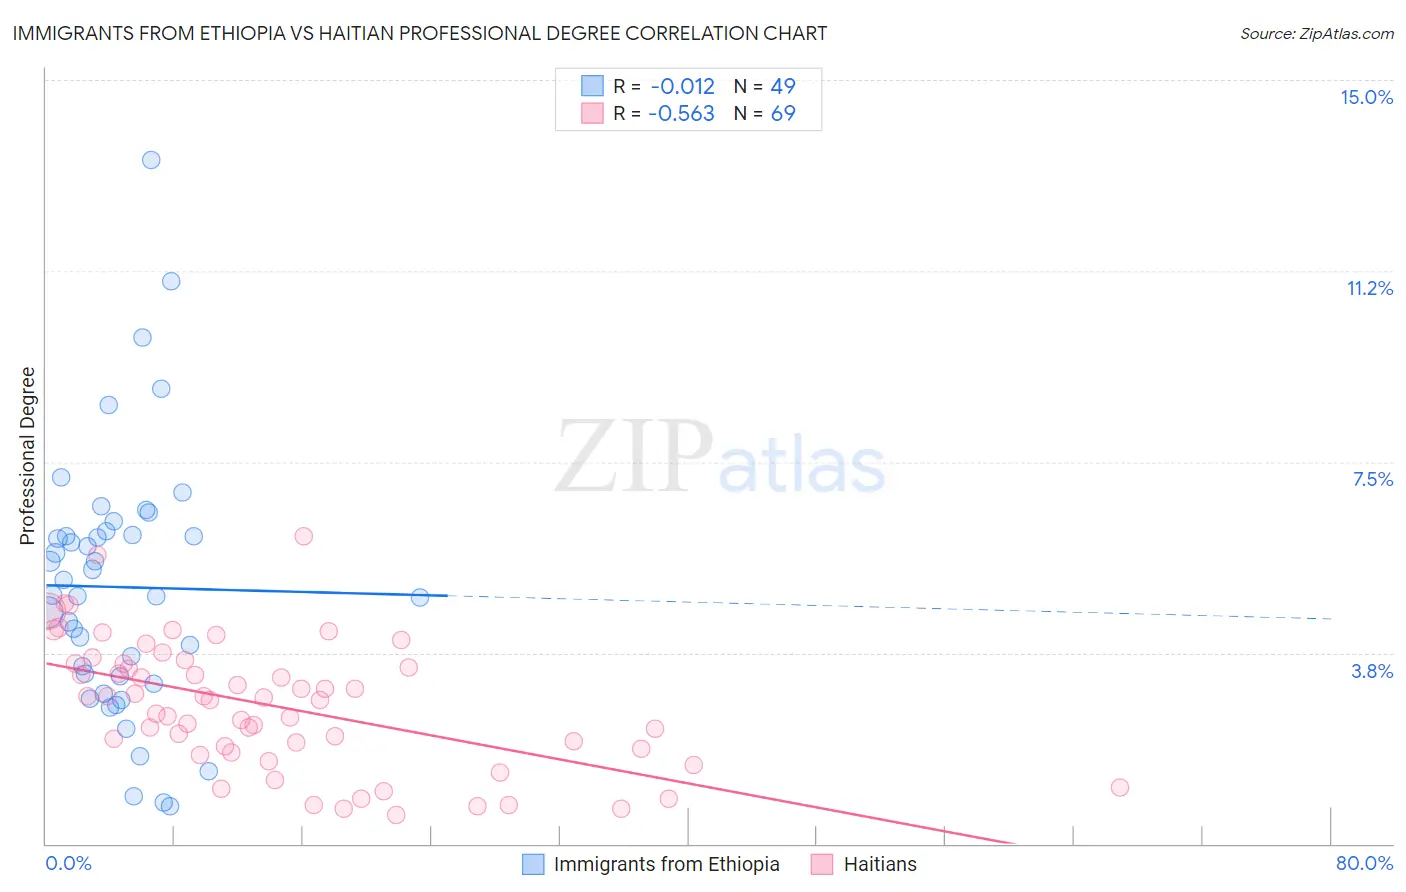
Immigrants from Ethiopia vs Haitian Professional Degree Correlation Chart

The statistical analysis conducted on geographies consisting of 211,364,222 people shows no correlation between the proportion of Immigrants from Ethiopia and percentage of population with at least professional degree education in the United States with a correlation coefficient (R) of -0.012 and weighted average of 5.3%. Similarly, the statistical analysis conducted on geographies consisting of 287,367,803 people shows a substantial negative correlation between the proportion of Haitians and percentage of population with at least professional degree education in the United States with a correlation coefficient (R) of -0.563 and weighted average of 3.5%, a difference of 53.5%.
Immigrants from Ethiopia vs Haitian Professional Degree

Professional Degree Correlation Summary

MeasurementImmigrants from EthiopiaHaitian
Minimum0.74%0.57%
Maximum13.4%6.1%
Range12.7%5.5%
Mean5.0%2.7%
Median4.9%2.8%
Interquartile 25% (IQ1)3.2%1.8%
Interquartile 75% (IQ3)6.1%3.5%
Interquartile Range (IQR)2.9%1.7%
Standard Deviation (Sample)2.5%1.3%
Standard Deviation (Population)2.5%1.2%

Similar Demographics by Professional Degree

Demographics Similar to Immigrants from Ethiopia by Professional Degree

In terms of professional degree, the demographic groups most similar to Immigrants from Ethiopia are Immigrants from Canada (5.3%, a difference of 0.040%), Armenian (5.3%, a difference of 0.050%), Immigrants from Indonesia (5.3%, a difference of 0.13%), Immigrants from North America (5.3%, a difference of 0.22%), and Ethiopian (5.4%, a difference of 0.26%).
DemographicsRating | RankProfessional Degree
Bhutanese
99.8
/100
|
#70
Exceptional
5.4%
Immigrants | Western Asia
99.8
/100
|
#71
Exceptional
5.4%
Lithuanians
99.8
/100
|
#72
Exceptional
5.4%
Immigrants | Romania
99.8
/100
|
#73
Exceptional
5.4%
Ethiopians
99.7
/100
|
#74
Exceptional
5.4%
Immigrants | Indonesia
99.7
/100
|
#75
Exceptional
5.3%
Immigrants | Canada
99.7
/100
|
#76
Exceptional
5.3%
Immigrants | Ethiopia
99.7
/100
|
#77
Exceptional
5.3%
Armenians
99.7
/100
|
#78
Exceptional
5.3%
Immigrants | North America
99.7
/100
|
#79
Exceptional
5.3%
Immigrants | England
99.6
/100
|
#80
Exceptional
5.3%
Immigrants | Brazil
99.6
/100
|
#81
Exceptional
5.3%
Romanians
99.6
/100
|
#82
Exceptional
5.3%
Carpatho Rusyns
99.6
/100
|
#83
Exceptional
5.3%
Immigrants | Croatia
99.6
/100
|
#84
Exceptional
5.3%

Demographics Similar to Haitians by Professional Degree

In terms of professional degree, the demographic groups most similar to Haitians are Immigrants from El Salvador (3.5%, a difference of 0.10%), Blackfeet (3.5%, a difference of 0.15%), Guatemalan (3.5%, a difference of 0.32%), Chippewa (3.5%, a difference of 0.33%), and Honduran (3.5%, a difference of 0.34%).
DemographicsRating | RankProfessional Degree
Immigrants | Portugal
0.5
/100
|
#279
Tragic
3.5%
Dominicans
0.5
/100
|
#280
Tragic
3.5%
Apache
0.5
/100
|
#281
Tragic
3.5%
Immigrants | Caribbean
0.5
/100
|
#282
Tragic
3.5%
Comanche
0.4
/100
|
#283
Tragic
3.5%
Salvadorans
0.4
/100
|
#284
Tragic
3.5%
Hondurans
0.3
/100
|
#285
Tragic
3.5%
Haitians
0.3
/100
|
#286
Tragic
3.5%
Immigrants | El Salvador
0.3
/100
|
#287
Tragic
3.5%
Blackfeet
0.3
/100
|
#288
Tragic
3.5%
Guatemalans
0.3
/100
|
#289
Tragic
3.5%
Chippewa
0.3
/100
|
#290
Tragic
3.5%
Alaska Natives
0.3
/100
|
#291
Tragic
3.5%
Immigrants | Belize
0.3
/100
|
#292
Tragic
3.5%
Immigrants | Honduras
0.3
/100
|
#293
Tragic
3.5%