Immigrants from Eritrea vs Ugandan 10th Grade

COMPARE

Immigrants from Eritrea
Race
Ancestry
AfghanAfricanAlaska NativeAlaskan AthabascanAlbanianAleutAlsatianAmericanApacheArabArapahoArgentineanArmenianAssyrian/Chaldean/SyriacAustralianAustrianBahamianBangladeshiBarbadianBasqueBelgianBelizeanBermudanBhutaneseBlackfeetBolivianBrazilianBritishBritish West IndianBulgarianBurmeseCajunCambodianCanadianCape VerdeanCarpatho RusynCelticCentral AmericanCentral American IndianCherokeeCheyenneChickasawChileanChineseChippewaChoctawColombianColvilleComancheCosta RicanCreeCreekCroatianCrowCubanCypriotCzechCzechoslovakianDanishDelawareDominicanDutchDutch West IndianEastern EuropeanEcuadorianEgyptianEnglishEstonianEthiopianEuropeanFijianFilipinoFinnishFrenchFrench American IndianFrench CanadianGermanGerman RussianGhanaianGreekGuamanian/ChamorroGuatemalanGuyaneseHaitianHmongHonduranHopiHoumaHungarianIcelanderIndian (Asian)IndonesianInupiatIranianIraqiIrishIroquoisIsraeliItalianJamaicanJapaneseJordanianKenyanKiowaKoreanLaotianLatvianLebaneseLiberianLithuanianLumbeeLuxembourgerMacedonianMalaysianMalteseMarshalleseMenomineeMexicanMexican American IndianMongolianMoroccanNative HawaiianNavajoNepaleseNew ZealanderNicaraguanNigerianNorthern EuropeanNorwegianOkinawanOsageOttawaPaiutePakistaniPalestinianPanamanianParaguayanPennsylvania GermanPeruvianPimaPolishPortuguesePotawatomiPuebloPuerto RicanPuget Sound SalishRomanianRussianSalvadoranSamoanScandinavianScotch-IrishScottishSeminoleSenegaleseSerbianShoshoneSierra LeoneanSiouxSlavicSlovakSloveneSomaliSouth AfricanSouth AmericanSouth American IndianSoviet UnionSpaniardSpanishSpanish AmericanSpanish American IndianSri LankanSubsaharan AfricanSudaneseSwedishSwissSyrianTaiwaneseThaiTlingit-HaidaTohono O'OdhamTonganTrinidadian and TobagonianTsimshianTurkishU.S. Virgin IslanderUkrainianUruguayanUteVenezuelanVietnameseWelshWest IndianYakamaYaquiYugoslavianYumanYup'ikZimbabwean
Immigration
NonimmigrantsImmigrantsAfghanistanAfricaAlbaniaArgentinaArmeniaAsiaAustraliaAustriaBahamasBangladeshBarbadosBelarusBelgiumBelizeBoliviaBosnia and HerzegovinaBrazilBulgariaBurma/MyanmarCabo VerdeCambodiaCameroonCanadaCaribbeanCentral AmericaChileChinaColombiaCongoCosta RicaCroatiaCubaCzechoslovakiaDenmarkDominicaDominican RepublicEastern AfricaEastern AsiaEastern EuropeEcuadorEgyptEl SalvadorEnglandEritreaEthiopiaEuropeFijiFranceGermanyGhanaGreeceGrenadaGuatemalaGuyanaHaitiHondurasHong KongHungaryIndiaIndonesiaIranIraqIrelandIsraelItalyJamaicaJapanJordanKazakhstanKenyaKoreaKuwaitLaosLatin AmericaLatviaLebanonLiberiaLithuaniaMalaysiaMexicoMicronesiaMiddle AfricaMoldovaMoroccoNepalNetherlandsNicaraguaNigeriaNorth AmericaNorth MacedoniaNorthern AfricaNorthern EuropeNorwayOceaniaPakistanPanamaPeruPhilippinesPolandPortugalRomaniaRussiaSaudi ArabiaScotlandSenegalSerbiaSierra LeoneSingaporeSomaliaSouth AfricaSouth AmericaSouth Central AsiaSouth Eastern AsiaSouthern EuropeSpainSri LankaSt. Vincent and the GrenadinesSudanSwedenSwitzerlandSyriaTaiwanThailandTrinidad and TobagoTurkeyUgandaUkraineUruguayUzbekistanVenezuelaVietnamWest IndiesWestern AfricaWestern AsiaWestern EuropeYemenZaireZimbabweAzores
Ugandan
Race
Ancestry
AfghanAfricanAlaska NativeAlaskan AthabascanAlbanianAleutAlsatianAmericanApacheArabArapahoArgentineanArmenianAssyrian/Chaldean/SyriacAustralianAustrianBahamianBangladeshiBarbadianBasqueBelgianBelizeanBermudanBhutaneseBlackfeetBolivianBrazilianBritishBritish West IndianBulgarianBurmeseCajunCambodianCanadianCape VerdeanCarpatho RusynCelticCentral AmericanCentral American IndianCherokeeCheyenneChickasawChileanChineseChippewaChoctawColombianColvilleComancheCosta RicanCreeCreekCroatianCrowCubanCypriotCzechCzechoslovakianDanishDelawareDominicanDutchDutch West IndianEastern EuropeanEcuadorianEgyptianEnglishEstonianEthiopianEuropeanFijianFilipinoFinnishFrenchFrench American IndianFrench CanadianGermanGerman RussianGhanaianGreekGuamanian/ChamorroGuatemalanGuyaneseHaitianHmongHonduranHopiHoumaHungarianIcelanderIndian (Asian)IndonesianInupiatIranianIraqiIrishIroquoisIsraeliItalianJamaicanJapaneseJordanianKenyanKiowaKoreanLaotianLatvianLebaneseLiberianLithuanianLumbeeLuxembourgerMacedonianMalaysianMalteseMarshalleseMenomineeMexicanMexican American IndianMongolianMoroccanNative HawaiianNavajoNepaleseNew ZealanderNicaraguanNigerianNorthern EuropeanNorwegianOkinawanOsageOttawaPaiutePakistaniPalestinianPanamanianParaguayanPennsylvania GermanPeruvianPimaPolishPortuguesePotawatomiPuebloPuerto RicanPuget Sound SalishRomanianRussianSalvadoranSamoanScandinavianScotch-IrishScottishSeminoleSenegaleseSerbianShoshoneSierra LeoneanSiouxSlavicSlovakSloveneSomaliSouth AfricanSouth AmericanSouth American IndianSoviet UnionSpaniardSpanishSpanish AmericanSpanish American IndianSri LankanSubsaharan AfricanSudaneseSwedishSwissSyrianTaiwaneseThaiTlingit-HaidaTohono O'OdhamTonganTrinidadian and TobagonianTsimshianTurkishU.S. Virgin IslanderUgandanUkrainianUruguayanUteVenezuelanVietnameseWelshWest IndianYakamaYaquiYugoslavianYumanYup'ikZimbabwean
Immigration
NonimmigrantsImmigrantsAfghanistanAfricaAlbaniaArgentinaArmeniaAsiaAustraliaAustriaBahamasBangladeshBarbadosBelarusBelgiumBelizeBoliviaBosnia and HerzegovinaBrazilBulgariaBurma/MyanmarCabo VerdeCambodiaCameroonCanadaCaribbeanCentral AmericaChileChinaColombiaCongoCosta RicaCroatiaCubaCzechoslovakiaDenmarkDominicaDominican RepublicEastern AfricaEastern AsiaEastern EuropeEcuadorEgyptEl SalvadorEnglandEthiopiaEuropeFijiFranceGermanyGhanaGreeceGrenadaGuatemalaGuyanaHaitiHondurasHong KongHungaryIndiaIndonesiaIranIraqIrelandIsraelItalyJamaicaJapanJordanKazakhstanKenyaKoreaKuwaitLaosLatin AmericaLatviaLebanonLiberiaLithuaniaMalaysiaMexicoMicronesiaMiddle AfricaMoldovaMoroccoNepalNetherlandsNicaraguaNigeriaNorth AmericaNorth MacedoniaNorthern AfricaNorthern EuropeNorwayOceaniaPakistanPanamaPeruPhilippinesPolandPortugalRomaniaRussiaSaudi ArabiaScotlandSenegalSerbiaSierra LeoneSingaporeSomaliaSouth AfricaSouth AmericaSouth Central AsiaSouth Eastern AsiaSouthern EuropeSpainSri LankaSt. Vincent and the GrenadinesSudanSwedenSwitzerlandSyriaTaiwanThailandTrinidad and TobagoTurkeyUgandaUkraineUruguayUzbekistanVenezuelaVietnamWest IndiesWestern AfricaWestern AsiaWestern EuropeYemenZaireZimbabweAzores
10th Grade
Income
Poverty
Unemployment
Labor Participation
Family Structure
Vehicle Availability
Education Level
Disability

10th Grade Comparison

Immigrants from Eritrea

Ugandans

Tragic
Excellent
92.5%
10TH GRADE
0.3/ 100
METRIC RATING
271st/ 347
METRIC RANK
94.0%
10TH GRADE
80.7/ 100
METRIC RATING
149th/ 347
METRIC RANK

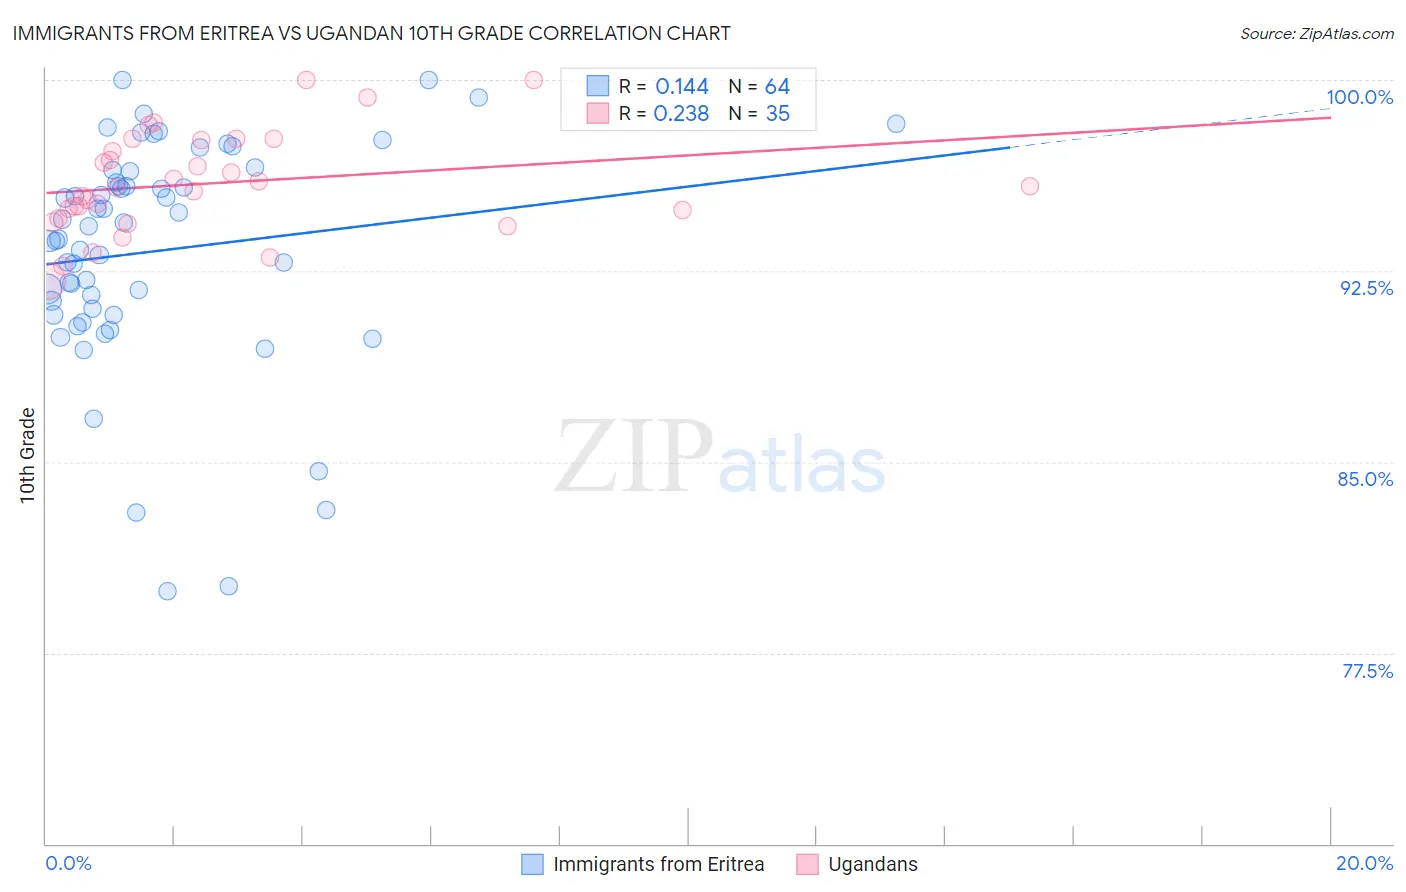
Immigrants from Eritrea vs Ugandan 10th Grade Correlation Chart

The statistical analysis conducted on geographies consisting of 104,754,230 people shows a poor positive correlation between the proportion of Immigrants from Eritrea and percentage of population with at least 10th grade education in the United States with a correlation coefficient (R) of 0.144 and weighted average of 92.5%. Similarly, the statistical analysis conducted on geographies consisting of 93,990,882 people shows a weak positive correlation between the proportion of Ugandans and percentage of population with at least 10th grade education in the United States with a correlation coefficient (R) of 0.238 and weighted average of 94.0%, a difference of 1.6%.
Immigrants from Eritrea vs Ugandan 10th Grade

10th Grade Correlation Summary

MeasurementImmigrants from EritreaUgandan
Minimum79.9%92.1%
Maximum100.0%100.0%
Range20.1%7.9%
Mean93.3%95.9%
Median94.0%95.8%
Interquartile 25% (IQ1)90.9%94.6%
Interquartile 75% (IQ3)96.2%97.6%
Interquartile Range (IQR)5.3%3.1%
Standard Deviation (Sample)4.4%2.0%
Standard Deviation (Population)4.4%1.9%

Similar Demographics by 10th Grade

Demographics Similar to Immigrants from Eritrea by 10th Grade

In terms of 10th grade, the demographic groups most similar to Immigrants from Eritrea are Immigrants from Uruguay (92.5%, a difference of 0.010%), Immigrants from Western Africa (92.5%, a difference of 0.010%), Immigrants from Colombia (92.5%, a difference of 0.020%), Taiwanese (92.5%, a difference of 0.030%), and Immigrants from Ghana (92.5%, a difference of 0.030%).
DemographicsRating | Rank10th Grade
Peruvians
0.4
/100
|
#264
Tragic
92.6%
Dutch West Indians
0.4
/100
|
#265
Tragic
92.6%
Immigrants | Philippines
0.4
/100
|
#266
Tragic
92.6%
Taiwanese
0.3
/100
|
#267
Tragic
92.5%
Immigrants | Ghana
0.3
/100
|
#268
Tragic
92.5%
Immigrants | Colombia
0.3
/100
|
#269
Tragic
92.5%
Immigrants | Uruguay
0.3
/100
|
#270
Tragic
92.5%
Immigrants | Eritrea
0.3
/100
|
#271
Tragic
92.5%
Immigrants | Western Africa
0.3
/100
|
#272
Tragic
92.5%
Trinidadians and Tobagonians
0.2
/100
|
#273
Tragic
92.4%
Immigrants | Congo
0.2
/100
|
#274
Tragic
92.4%
West Indians
0.2
/100
|
#275
Tragic
92.4%
Immigrants | Trinidad and Tobago
0.1
/100
|
#276
Tragic
92.3%
Navajo
0.1
/100
|
#277
Tragic
92.3%
Barbadians
0.1
/100
|
#278
Tragic
92.2%

Demographics Similar to Ugandans by 10th Grade

In terms of 10th grade, the demographic groups most similar to Ugandans are Arab (94.0%, a difference of 0.0%), Immigrants from Ukraine (94.0%, a difference of 0.010%), Egyptian (94.0%, a difference of 0.020%), Kenyan (94.0%, a difference of 0.020%), and Chickasaw (94.1%, a difference of 0.030%).
DemographicsRating | Rank10th Grade
Albanians
86.5
/100
|
#142
Excellent
94.1%
Cherokee
84.9
/100
|
#143
Excellent
94.1%
Immigrants | Kazakhstan
84.9
/100
|
#144
Excellent
94.1%
Immigrants | Nonimmigrants
83.8
/100
|
#145
Excellent
94.1%
Chickasaw
82.6
/100
|
#146
Excellent
94.1%
Immigrants | Ukraine
81.5
/100
|
#147
Excellent
94.0%
Arabs
80.9
/100
|
#148
Excellent
94.0%
Ugandans
80.7
/100
|
#149
Excellent
94.0%
Egyptians
79.6
/100
|
#150
Good
94.0%
Kenyans
79.1
/100
|
#151
Good
94.0%
Immigrants | Italy
78.0
/100
|
#152
Good
94.0%
Immigrants | Brazil
75.5
/100
|
#153
Good
94.0%
Immigrants | Kenya
75.3
/100
|
#154
Good
94.0%
Spanish
74.9
/100
|
#155
Good
94.0%
Mongolians
74.4
/100
|
#156
Good
94.0%