Immigrants from El Salvador vs Venezuelan 4th Grade
COMPARE
Immigrants from El Salvador
Venezuelan
4th Grade
4th Grade Comparison
Immigrants from El Salvador
Venezuelans
94.8%
4TH GRADE
0.0/ 100
METRIC RATING
346th/ 347
METRIC RANK
97.6%
4TH GRADE
58.7/ 100
METRIC RATING
165th/ 347
METRIC RANK
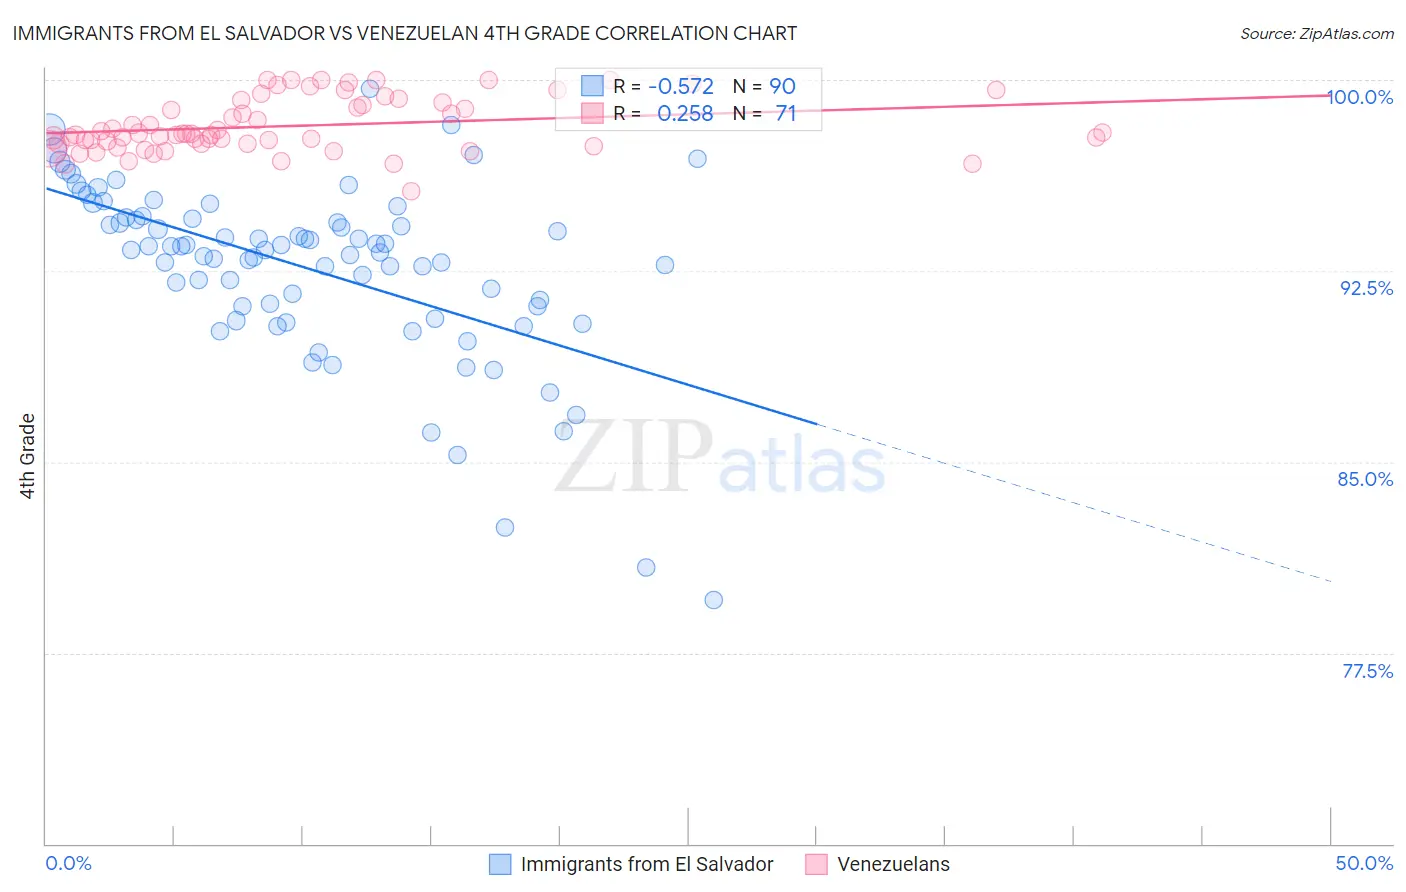
Immigrants from El Salvador vs Venezuelan 4th Grade Correlation Chart
The statistical analysis conducted on geographies consisting of 357,852,938 people shows a substantial negative correlation between the proportion of Immigrants from El Salvador and percentage of population with at least 4th grade education in the United States with a correlation coefficient (R) of -0.572 and weighted average of 94.8%. Similarly, the statistical analysis conducted on geographies consisting of 306,323,638 people shows a weak positive correlation between the proportion of Venezuelans and percentage of population with at least 4th grade education in the United States with a correlation coefficient (R) of 0.258 and weighted average of 97.6%, a difference of 2.9%.
4th Grade Correlation Summary
| Measurement | Immigrants from El Salvador | Venezuelan |
| Minimum | 79.5% | 95.6% |
| Maximum | 99.7% | 100.0% |
| Range | 20.1% | 4.4% |
| Mean | 92.6% | 98.2% |
| Median | 93.3% | 97.9% |
| Interquartile 25% (IQ1) | 91.1% | 97.5% |
| Interquartile 75% (IQ3) | 94.6% | 99.1% |
| Interquartile Range (IQR) | 3.4% | 1.6% |
| Standard Deviation (Sample) | 3.5% | 1.0% |
| Standard Deviation (Population) | 3.5% | 1.0% |
Similar Demographics by 4th Grade
Demographics Similar to Immigrants from El Salvador by 4th Grade
In terms of 4th grade, the demographic groups most similar to Immigrants from El Salvador are Spanish American Indian (94.6%, a difference of 0.18%), Salvadoran (95.0%, a difference of 0.28%), Immigrants from Mexico (95.1%, a difference of 0.29%), Immigrants from Guatemala (95.1%, a difference of 0.32%), and Immigrants from Central America (95.1%, a difference of 0.35%).
| Demographics | Rating | Rank | 4th Grade |
| Immigrants | Dominican Republic | 0.0 /100 | #333 | Tragic 95.7% |
| Immigrants | Cabo Verde | 0.0 /100 | #334 | Tragic 95.7% |
| Immigrants | Latin America | 0.0 /100 | #335 | Tragic 95.7% |
| Mexicans | 0.0 /100 | #336 | Tragic 95.6% |
| Central Americans | 0.0 /100 | #337 | Tragic 95.5% |
| Nepalese | 0.0 /100 | #338 | Tragic 95.5% |
| Guatemalans | 0.0 /100 | #339 | Tragic 95.3% |
| Yakama | 0.0 /100 | #340 | Tragic 95.2% |
| Immigrants | Yemen | 0.0 /100 | #341 | Tragic 95.2% |
| Immigrants | Central America | 0.0 /100 | #342 | Tragic 95.1% |
| Immigrants | Guatemala | 0.0 /100 | #343 | Tragic 95.1% |
| Immigrants | Mexico | 0.0 /100 | #344 | Tragic 95.1% |
| Salvadorans | 0.0 /100 | #345 | Tragic 95.0% |
| Immigrants | El Salvador | 0.0 /100 | #346 | Tragic 94.8% |
| Spanish American Indians | 0.0 /100 | #347 | Tragic 94.6% |
Demographics Similar to Venezuelans by 4th Grade
In terms of 4th grade, the demographic groups most similar to Venezuelans are Ugandan (97.6%, a difference of 0.0%), Apache (97.6%, a difference of 0.010%), Marshallese (97.6%, a difference of 0.010%), Bermudan (97.6%, a difference of 0.010%), and Immigrants from Iran (97.6%, a difference of 0.010%).
| Demographics | Rating | Rank | 4th Grade |
| French American Indians | 65.9 /100 | #158 | Good 97.6% |
| Immigrants | Italy | 63.7 /100 | #159 | Good 97.6% |
| Apache | 61.3 /100 | #160 | Good 97.6% |
| Marshallese | 60.8 /100 | #161 | Good 97.6% |
| Bermudans | 60.5 /100 | #162 | Good 97.6% |
| Immigrants | Iran | 60.3 /100 | #163 | Good 97.6% |
| Ugandans | 58.9 /100 | #164 | Average 97.6% |
| Venezuelans | 58.7 /100 | #165 | Average 97.6% |
| Kenyans | 56.5 /100 | #166 | Average 97.5% |
| Immigrants | Poland | 55.9 /100 | #167 | Average 97.5% |
| Immigrants | Belarus | 55.8 /100 | #168 | Average 97.5% |
| Chileans | 54.4 /100 | #169 | Average 97.5% |
| Immigrants | Spain | 51.8 /100 | #170 | Average 97.5% |
| Brazilians | 51.5 /100 | #171 | Average 97.5% |
| Immigrants | Sri Lanka | 51.1 /100 | #172 | Average 97.5% |