Immigrants from Egypt vs Tongan 11th Grade
COMPARE
Immigrants from Egypt
Tongan
11th Grade
11th Grade Comparison
Immigrants from Egypt
Tongans
92.8%
11TH GRADE
77.5/ 100
METRIC RATING
150th/ 347
METRIC RANK
92.2%
11TH GRADE
19.8/ 100
METRIC RATING
209th/ 347
METRIC RANK
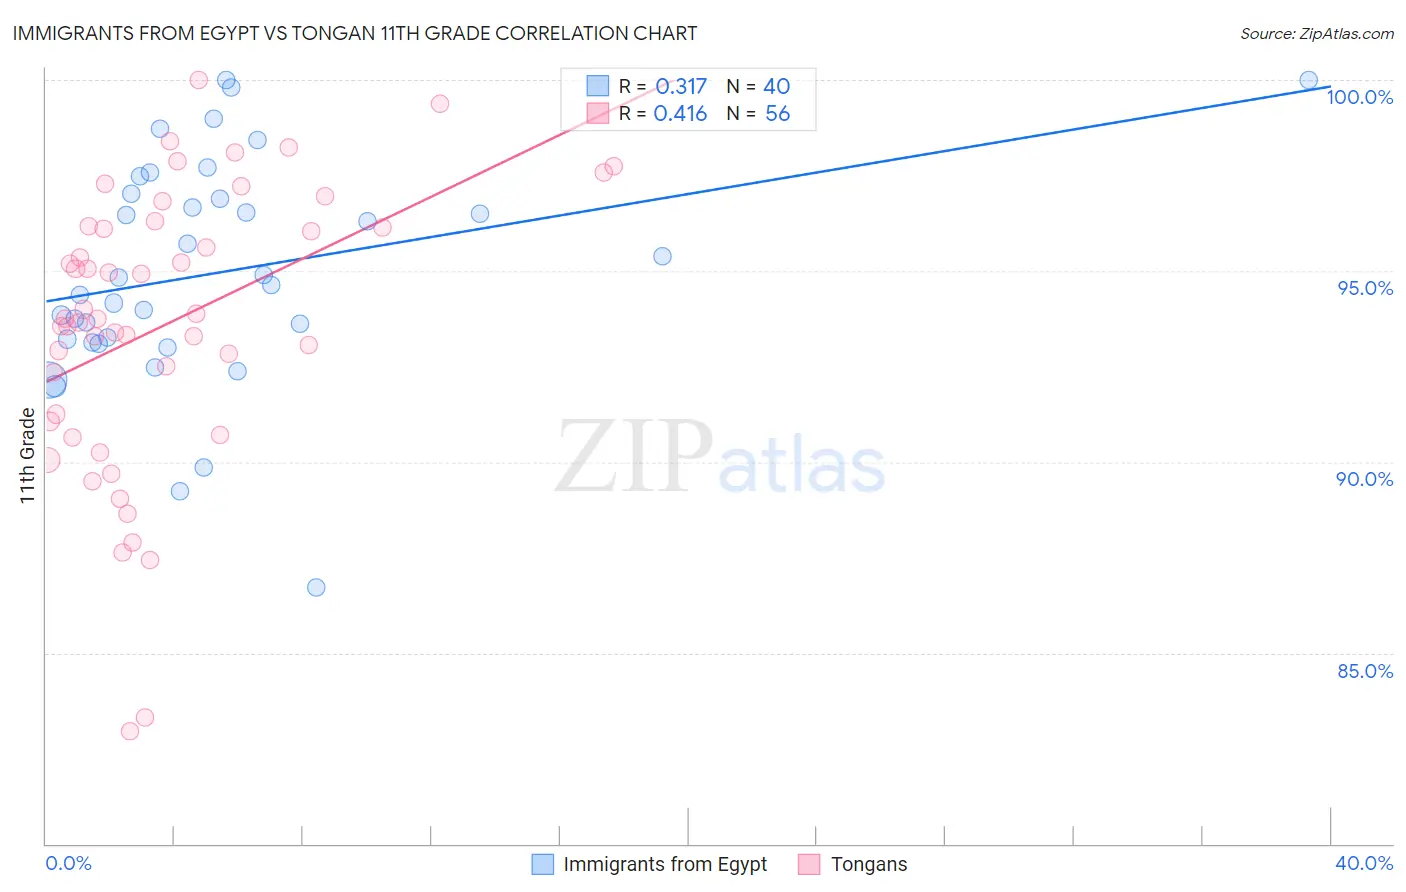
Immigrants from Egypt vs Tongan 11th Grade Correlation Chart
The statistical analysis conducted on geographies consisting of 245,484,455 people shows a mild positive correlation between the proportion of Immigrants from Egypt and percentage of population with at least 11th grade education in the United States with a correlation coefficient (R) of 0.317 and weighted average of 92.8%. Similarly, the statistical analysis conducted on geographies consisting of 102,873,790 people shows a moderate positive correlation between the proportion of Tongans and percentage of population with at least 11th grade education in the United States with a correlation coefficient (R) of 0.416 and weighted average of 92.2%, a difference of 0.65%.
11th Grade Correlation Summary
| Measurement | Immigrants from Egypt | Tongan |
| Minimum | 86.7% | 82.9% |
| Maximum | 100.0% | 100.0% |
| Range | 13.3% | 17.1% |
| Mean | 95.0% | 93.6% |
| Median | 94.7% | 93.8% |
| Interquartile 25% (IQ1) | 93.2% | 91.2% |
| Interquartile 75% (IQ3) | 97.0% | 96.2% |
| Interquartile Range (IQR) | 3.8% | 5.0% |
| Standard Deviation (Sample) | 2.9% | 3.7% |
| Standard Deviation (Population) | 2.9% | 3.7% |
Similar Demographics by 11th Grade
Demographics Similar to Immigrants from Egypt by 11th Grade
In terms of 11th grade, the demographic groups most similar to Immigrants from Egypt are Immigrants from Poland (92.8%, a difference of 0.010%), Iroquois (92.8%, a difference of 0.020%), Immigrants from Kenya (92.8%, a difference of 0.020%), Hmong (92.8%, a difference of 0.020%), and Pakistani (92.8%, a difference of 0.030%).
| Demographics | Rating | Rank | 11th Grade |
| Ugandans | 81.4 /100 | #143 | Excellent 92.9% |
| Assyrians/Chaldeans/Syriacs | 80.5 /100 | #144 | Excellent 92.8% |
| Pakistanis | 79.6 /100 | #145 | Good 92.8% |
| Iroquois | 79.1 /100 | #146 | Good 92.8% |
| Immigrants | Kenya | 78.7 /100 | #147 | Good 92.8% |
| Hmong | 78.6 /100 | #148 | Good 92.8% |
| Immigrants | Poland | 78.5 /100 | #149 | Good 92.8% |
| Immigrants | Egypt | 77.5 /100 | #150 | Good 92.8% |
| Potawatomi | 74.3 /100 | #151 | Good 92.8% |
| Iraqis | 74.2 /100 | #152 | Good 92.8% |
| Brazilians | 73.9 /100 | #153 | Good 92.8% |
| Osage | 73.4 /100 | #154 | Good 92.7% |
| Argentineans | 73.4 /100 | #155 | Good 92.7% |
| Immigrants | Spain | 73.0 /100 | #156 | Good 92.7% |
| Immigrants | Eastern Asia | 72.6 /100 | #157 | Good 92.7% |
Demographics Similar to Tongans by 11th Grade
In terms of 11th grade, the demographic groups most similar to Tongans are Ethiopian (92.2%, a difference of 0.010%), Colville (92.2%, a difference of 0.030%), Immigrants from Micronesia (92.2%, a difference of 0.030%), Immigrants from Oceania (92.2%, a difference of 0.040%), and Immigrants from Sudan (92.3%, a difference of 0.050%).
| Demographics | Rating | Rank | 11th Grade |
| Immigrants | Eastern Africa | 24.1 /100 | #202 | Fair 92.3% |
| Immigrants | Sudan | 23.5 /100 | #203 | Fair 92.3% |
| Immigrants | Hong Kong | 23.3 /100 | #204 | Fair 92.2% |
| Kiowa | 23.2 /100 | #205 | Fair 92.2% |
| Bolivians | 23.2 /100 | #206 | Fair 92.2% |
| Immigrants | Oceania | 22.4 /100 | #207 | Fair 92.2% |
| Colville | 21.8 /100 | #208 | Fair 92.2% |
| Tongans | 19.8 /100 | #209 | Poor 92.2% |
| Ethiopians | 18.8 /100 | #210 | Poor 92.2% |
| Immigrants | Micronesia | 17.7 /100 | #211 | Poor 92.2% |
| Koreans | 14.4 /100 | #212 | Poor 92.1% |
| Immigrants | Ethiopia | 13.9 /100 | #213 | Poor 92.1% |
| Afghans | 12.8 /100 | #214 | Poor 92.1% |
| Immigrants | Southern Europe | 12.5 /100 | #215 | Poor 92.1% |
| Somalis | 11.6 /100 | #216 | Poor 92.1% |