Immigrants from Egypt vs Immigrants from Ghana 2nd Grade

COMPARE

Immigrants from Egypt
Race
Ancestry
AfghanAfricanAlaska NativeAlaskan AthabascanAlbanianAleutAlsatianAmericanApacheArabArapahoArgentineanArmenianAssyrian/Chaldean/SyriacAustralianAustrianBahamianBangladeshiBarbadianBasqueBelgianBelizeanBermudanBhutaneseBlackfeetBolivianBrazilianBritishBritish West IndianBulgarianBurmeseCajunCambodianCanadianCape VerdeanCarpatho RusynCelticCentral AmericanCentral American IndianCherokeeCheyenneChickasawChileanChineseChippewaChoctawColombianColvilleComancheCosta RicanCreeCreekCroatianCrowCubanCypriotCzechCzechoslovakianDanishDelawareDominicanDutchDutch West IndianEastern EuropeanEcuadorianEgyptianEnglishEstonianEthiopianEuropeanFijianFilipinoFinnishFrenchFrench American IndianFrench CanadianGermanGerman RussianGhanaianGreekGuamanian/ChamorroGuatemalanGuyaneseHaitianHmongHonduranHopiHoumaHungarianIcelanderIndian (Asian)IndonesianInupiatIranianIraqiIrishIroquoisIsraeliItalianJamaicanJapaneseJordanianKenyanKiowaKoreanLaotianLatvianLebaneseLiberianLithuanianLumbeeLuxembourgerMacedonianMalaysianMalteseMarshalleseMenomineeMexicanMexican American IndianMongolianMoroccanNative HawaiianNavajoNepaleseNew ZealanderNicaraguanNigerianNorthern EuropeanNorwegianOkinawanOsageOttawaPaiutePakistaniPalestinianPanamanianParaguayanPennsylvania GermanPeruvianPimaPolishPortuguesePotawatomiPuebloPuerto RicanPuget Sound SalishRomanianRussianSalvadoranSamoanScandinavianScotch-IrishScottishSeminoleSenegaleseSerbianShoshoneSierra LeoneanSiouxSlavicSlovakSloveneSomaliSouth AfricanSouth AmericanSouth American IndianSoviet UnionSpaniardSpanishSpanish AmericanSpanish American IndianSri LankanSubsaharan AfricanSudaneseSwedishSwissSyrianTaiwaneseThaiTlingit-HaidaTohono O'OdhamTonganTrinidadian and TobagonianTsimshianTurkishU.S. Virgin IslanderUgandanUkrainianUruguayanUteVenezuelanVietnameseWelshWest IndianYakamaYaquiYugoslavianYumanYup'ikZimbabwean
Immigration
NonimmigrantsImmigrantsAfghanistanAfricaAlbaniaArgentinaArmeniaAsiaAustraliaAustriaBahamasBangladeshBarbadosBelarusBelgiumBelizeBoliviaBosnia and HerzegovinaBrazilBulgariaBurma/MyanmarCabo VerdeCambodiaCameroonCanadaCaribbeanCentral AmericaChileChinaColombiaCongoCosta RicaCroatiaCubaCzechoslovakiaDenmarkDominicaDominican RepublicEastern AfricaEastern AsiaEastern EuropeEcuadorEgyptEl SalvadorEnglandEritreaEthiopiaEuropeFijiFranceGermanyGreeceGrenadaGuatemalaGuyanaHaitiHondurasHong KongHungaryIndiaIndonesiaIranIraqIrelandIsraelItalyJamaicaJapanJordanKazakhstanKenyaKoreaKuwaitLaosLatin AmericaLatviaLebanonLiberiaLithuaniaMalaysiaMexicoMicronesiaMiddle AfricaMoldovaMoroccoNepalNetherlandsNicaraguaNigeriaNorth AmericaNorth MacedoniaNorthern AfricaNorthern EuropeNorwayOceaniaPakistanPanamaPeruPhilippinesPolandPortugalRomaniaRussiaSaudi ArabiaScotlandSenegalSerbiaSierra LeoneSingaporeSomaliaSouth AfricaSouth AmericaSouth Central AsiaSouth Eastern AsiaSouthern EuropeSpainSri LankaSt. Vincent and the GrenadinesSudanSwedenSwitzerlandSyriaTaiwanThailandTrinidad and TobagoTurkeyUgandaUkraineUruguayUzbekistanVenezuelaVietnamWest IndiesWestern AfricaWestern AsiaWestern EuropeYemenZaireZimbabweAzores
Immigrants from Ghana
Race
Ancestry
AfghanAfricanAlaska NativeAlaskan AthabascanAlbanianAleutAlsatianAmericanApacheArabArapahoArgentineanArmenianAssyrian/Chaldean/SyriacAustralianAustrianBahamianBangladeshiBarbadianBasqueBelgianBelizeanBermudanBhutaneseBlackfeetBolivianBrazilianBritishBritish West IndianBulgarianBurmeseCajunCambodianCanadianCape VerdeanCarpatho RusynCelticCentral AmericanCentral American IndianCherokeeCheyenneChickasawChileanChineseChippewaChoctawColombianColvilleComancheCosta RicanCreeCreekCroatianCrowCubanCypriotCzechCzechoslovakianDanishDelawareDominicanDutchDutch West IndianEastern EuropeanEcuadorianEgyptianEnglishEstonianEthiopianEuropeanFijianFilipinoFinnishFrenchFrench American IndianFrench CanadianGermanGerman RussianGhanaianGreekGuamanian/ChamorroGuatemalanGuyaneseHaitianHmongHonduranHopiHoumaHungarianIcelanderIndian (Asian)IndonesianInupiatIranianIraqiIrishIroquoisIsraeliItalianJamaicanJapaneseJordanianKenyanKiowaKoreanLaotianLatvianLebaneseLiberianLithuanianLumbeeLuxembourgerMacedonianMalaysianMalteseMarshalleseMenomineeMexicanMexican American IndianMongolianMoroccanNative HawaiianNavajoNepaleseNew ZealanderNicaraguanNigerianNorthern EuropeanNorwegianOkinawanOsageOttawaPaiutePakistaniPalestinianPanamanianParaguayanPennsylvania GermanPeruvianPimaPolishPortuguesePotawatomiPuebloPuerto RicanPuget Sound SalishRomanianRussianSalvadoranSamoanScandinavianScotch-IrishScottishSeminoleSenegaleseSerbianShoshoneSierra LeoneanSiouxSlavicSlovakSloveneSomaliSouth AfricanSouth AmericanSouth American IndianSoviet UnionSpaniardSpanishSpanish AmericanSpanish American IndianSri LankanSubsaharan AfricanSudaneseSwedishSwissSyrianTaiwaneseThaiTlingit-HaidaTohono O'OdhamTonganTrinidadian and TobagonianTsimshianTurkishU.S. Virgin IslanderUgandanUkrainianUruguayanUteVenezuelanVietnameseWelshWest IndianYakamaYaquiYugoslavianYumanYup'ikZimbabwean
Immigration
NonimmigrantsImmigrantsAfghanistanAfricaAlbaniaArgentinaArmeniaAsiaAustraliaAustriaBahamasBangladeshBarbadosBelarusBelgiumBelizeBoliviaBosnia and HerzegovinaBrazilBulgariaBurma/MyanmarCabo VerdeCambodiaCameroonCanadaCaribbeanCentral AmericaChileChinaColombiaCongoCosta RicaCroatiaCubaCzechoslovakiaDenmarkDominicaDominican RepublicEastern AfricaEastern AsiaEastern EuropeEcuadorEl SalvadorEnglandEritreaEthiopiaEuropeFijiFranceGermanyGhanaGreeceGrenadaGuatemalaGuyanaHaitiHondurasHong KongHungaryIndiaIndonesiaIranIraqIrelandIsraelItalyJamaicaJapanJordanKazakhstanKenyaKoreaKuwaitLaosLatin AmericaLatviaLebanonLiberiaLithuaniaMalaysiaMexicoMicronesiaMiddle AfricaMoldovaMoroccoNepalNetherlandsNicaraguaNigeriaNorth AmericaNorth MacedoniaNorthern AfricaNorthern EuropeNorwayOceaniaPakistanPanamaPeruPhilippinesPolandPortugalRomaniaRussiaSaudi ArabiaScotlandSenegalSerbiaSierra LeoneSingaporeSomaliaSouth AfricaSouth AmericaSouth Central AsiaSouth Eastern AsiaSouthern EuropeSpainSri LankaSt. Vincent and the GrenadinesSudanSwedenSwitzerlandSyriaTaiwanThailandTrinidad and TobagoTurkeyUgandaUkraineUruguayUzbekistanVenezuelaVietnamWest IndiesWestern AfricaWestern AsiaWestern EuropeYemenZaireZimbabweAzores
2nd Grade
Income
Poverty
Unemployment
Labor Participation
Family Structure
Vehicle Availability
Education Level
Disability

2nd Grade Comparison

Immigrants from Egypt

Immigrants from Ghana

Fair
Tragic
97.8%
2ND GRADE
24.4/ 100
METRIC RATING
199th/ 347
METRIC RANK
97.3%
2ND GRADE
0.1/ 100
METRIC RATING
279th/ 347
METRIC RANK

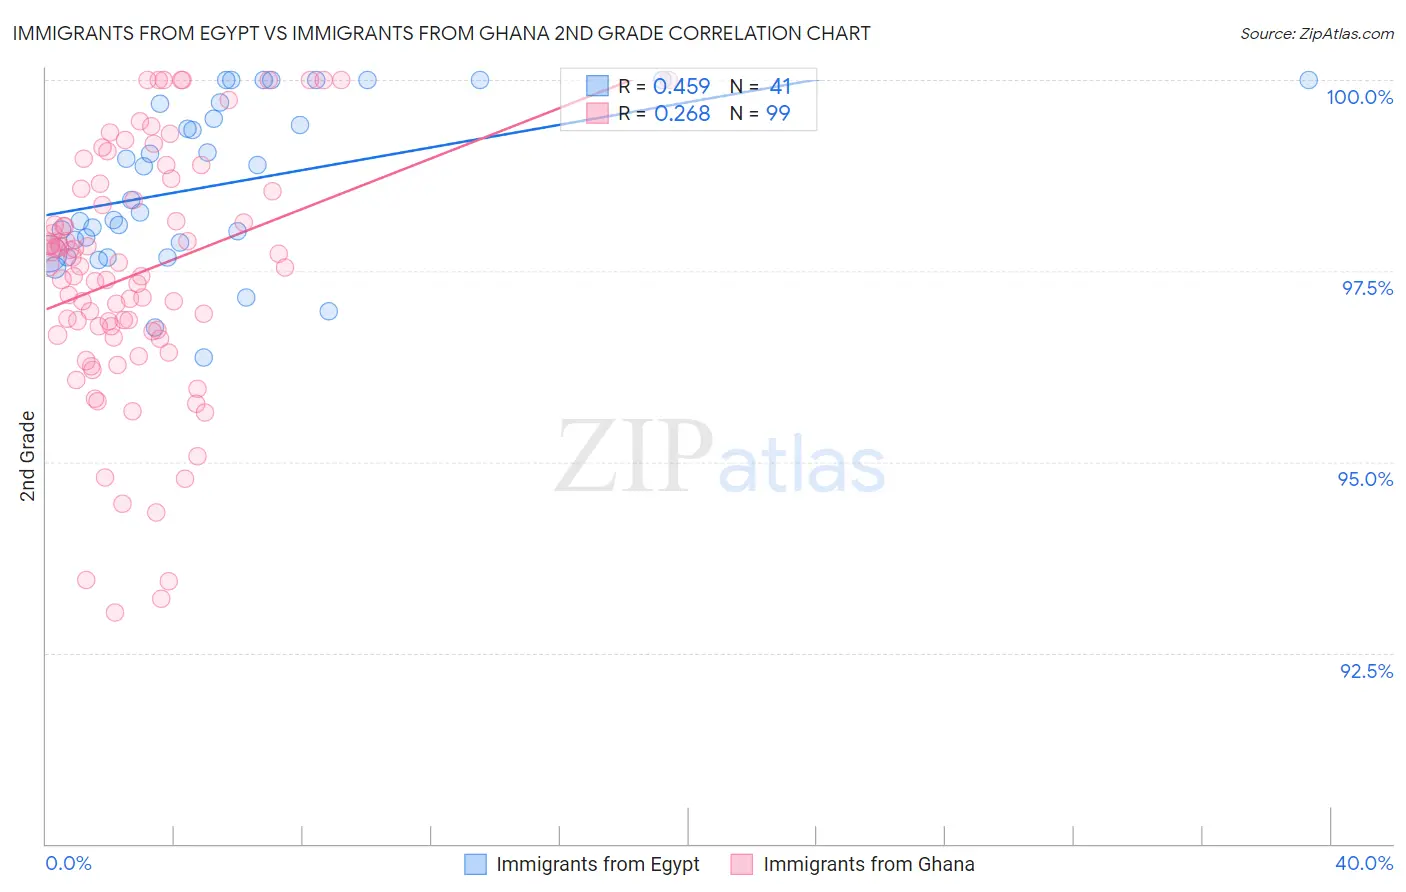
Immigrants from Egypt vs Immigrants from Ghana 2nd Grade Correlation Chart

The statistical analysis conducted on geographies consisting of 245,485,794 people shows a moderate positive correlation between the proportion of Immigrants from Egypt and percentage of population with at least 2nd grade education in the United States with a correlation coefficient (R) of 0.459 and weighted average of 97.8%. Similarly, the statistical analysis conducted on geographies consisting of 199,952,023 people shows a weak positive correlation between the proportion of Immigrants from Ghana and percentage of population with at least 2nd grade education in the United States with a correlation coefficient (R) of 0.268 and weighted average of 97.3%, a difference of 0.50%.
Immigrants from Egypt vs Immigrants from Ghana 2nd Grade

2nd Grade Correlation Summary

MeasurementImmigrants from EgyptImmigrants from Ghana
Minimum96.4%93.0%
Maximum100.0%100.0%
Range3.6%7.0%
Mean98.6%97.5%
Median98.4%97.6%
Interquartile 25% (IQ1)97.8%96.7%
Interquartile 75% (IQ3)99.7%98.6%
Interquartile Range (IQR)1.9%1.9%
Standard Deviation (Sample)1.1%1.6%
Standard Deviation (Population)1.0%1.6%

Similar Demographics by 2nd Grade

Demographics Similar to Immigrants from Egypt by 2nd Grade

In terms of 2nd grade, the demographic groups most similar to Immigrants from Egypt are Paiute (97.8%, a difference of 0.010%), Mongolian (97.8%, a difference of 0.010%), Immigrants from Kenya (97.8%, a difference of 0.010%), Immigrants from Uganda (97.8%, a difference of 0.010%), and Guamanian/Chamorro (97.8%, a difference of 0.010%).
DemographicsRating | Rank2nd Grade
Blacks/African Americans
29.9
/100
|
#192
Fair
97.8%
Hawaiians
28.5
/100
|
#193
Fair
97.8%
Paiute
27.0
/100
|
#194
Fair
97.8%
Mongolians
26.7
/100
|
#195
Fair
97.8%
Immigrants | Kenya
26.4
/100
|
#196
Fair
97.8%
Immigrants | Uganda
26.3
/100
|
#197
Fair
97.8%
Guamanians/Chamorros
25.7
/100
|
#198
Fair
97.8%
Immigrants | Egypt
24.4
/100
|
#199
Fair
97.8%
Immigrants | Lebanon
20.9
/100
|
#200
Fair
97.8%
Tohono O'odham
20.9
/100
|
#201
Fair
97.8%
Immigrants | Ukraine
20.5
/100
|
#202
Fair
97.8%
Yuman
20.0
/100
|
#203
Fair
97.8%
Immigrants | Albania
18.4
/100
|
#204
Poor
97.8%
Immigrants | Southern Europe
18.1
/100
|
#205
Poor
97.8%
Immigrants | Chile
17.3
/100
|
#206
Poor
97.7%

Demographics Similar to Immigrants from Ghana by 2nd Grade

In terms of 2nd grade, the demographic groups most similar to Immigrants from Ghana are Afghan (97.3%, a difference of 0.0%), Immigrants from Uzbekistan (97.3%, a difference of 0.010%), Trinidadian and Tobagonian (97.3%, a difference of 0.010%), Barbadian (97.3%, a difference of 0.010%), and Immigrants from Philippines (97.3%, a difference of 0.020%).
DemographicsRating | Rank2nd Grade
Immigrants | Peru
0.1
/100
|
#272
Tragic
97.4%
Immigrants | Bolivia
0.1
/100
|
#273
Tragic
97.4%
Ghanaians
0.1
/100
|
#274
Tragic
97.4%
Immigrants | China
0.1
/100
|
#275
Tragic
97.3%
Immigrants | Philippines
0.1
/100
|
#276
Tragic
97.3%
Immigrants | Western Africa
0.1
/100
|
#277
Tragic
97.3%
Immigrants | Uzbekistan
0.1
/100
|
#278
Tragic
97.3%
Immigrants | Ghana
0.1
/100
|
#279
Tragic
97.3%
Afghans
0.1
/100
|
#280
Tragic
97.3%
Trinidadians and Tobagonians
0.1
/100
|
#281
Tragic
97.3%
Barbadians
0.1
/100
|
#282
Tragic
97.3%
Immigrants | Trinidad and Tobago
0.0
/100
|
#283
Tragic
97.2%
Immigrants | West Indies
0.0
/100
|
#284
Tragic
97.2%
Immigrants | Hong Kong
0.0
/100
|
#285
Tragic
97.2%
Immigrants | Barbados
0.0
/100
|
#286
Tragic
97.2%