Immigrants from Egypt vs Immigrants from Argentina 1st Grade
COMPARE
Immigrants from Egypt
Immigrants from Argentina
1st Grade
1st Grade Comparison
Immigrants from Egypt
Immigrants from Argentina
97.8%
1ST GRADE
22.6/ 100
METRIC RATING
200th/ 347
METRIC RANK
97.9%
1ST GRADE
41.3/ 100
METRIC RATING
183rd/ 347
METRIC RANK
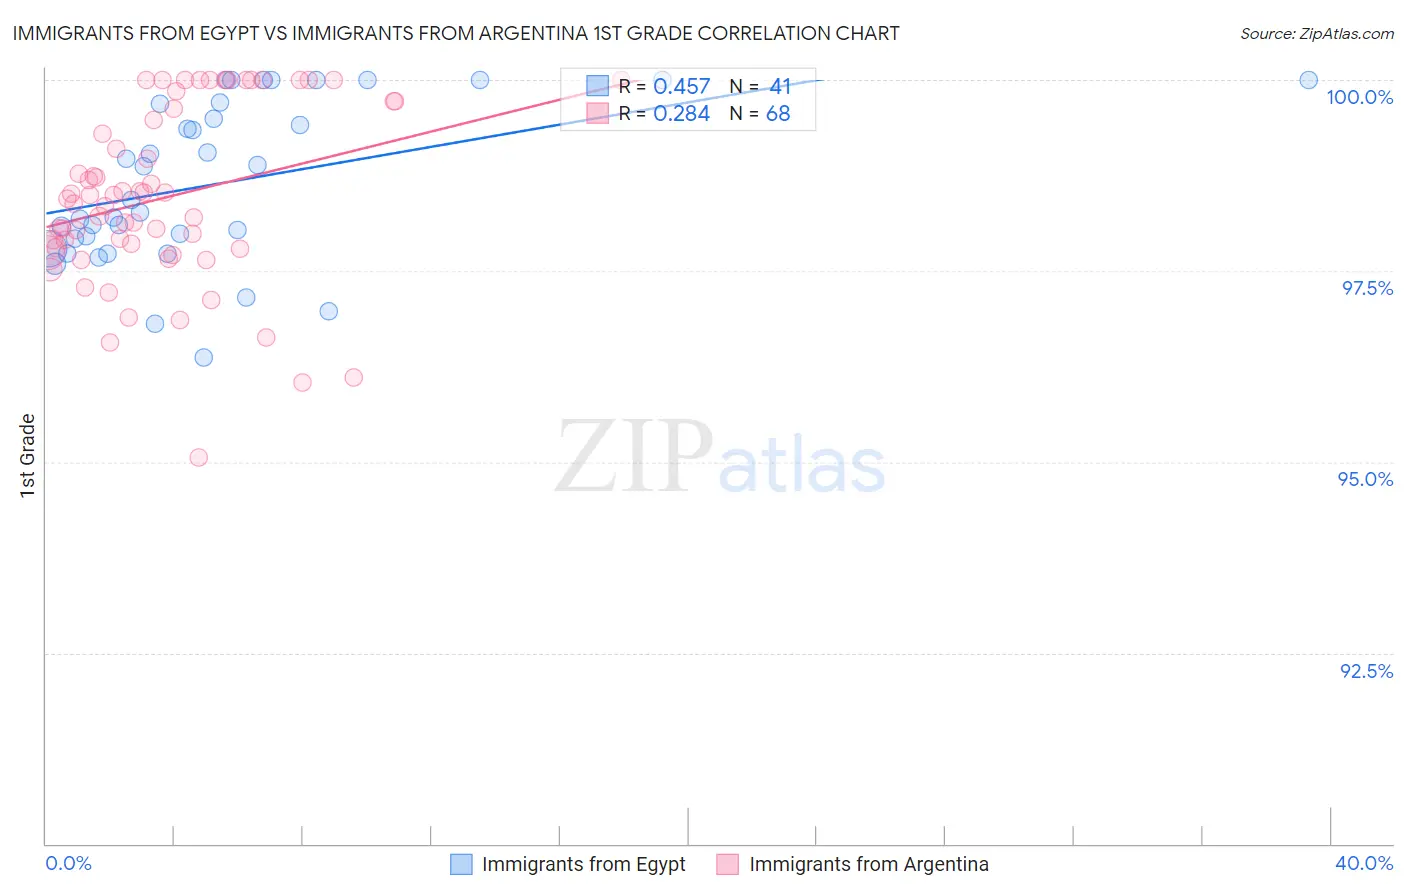
Immigrants from Egypt vs Immigrants from Argentina 1st Grade Correlation Chart
The statistical analysis conducted on geographies consisting of 245,485,794 people shows a moderate positive correlation between the proportion of Immigrants from Egypt and percentage of population with at least 1st grade education in the United States with a correlation coefficient (R) of 0.457 and weighted average of 97.8%. Similarly, the statistical analysis conducted on geographies consisting of 264,435,492 people shows a weak positive correlation between the proportion of Immigrants from Argentina and percentage of population with at least 1st grade education in the United States with a correlation coefficient (R) of 0.284 and weighted average of 97.9%, a difference of 0.070%.
1st Grade Correlation Summary
| Measurement | Immigrants from Egypt | Immigrants from Argentina |
| Minimum | 96.4% | 95.1% |
| Maximum | 100.0% | 100.0% |
| Range | 3.6% | 4.9% |
| Mean | 98.6% | 98.5% |
| Median | 98.4% | 98.5% |
| Interquartile 25% (IQ1) | 97.9% | 97.8% |
| Interquartile 75% (IQ3) | 99.7% | 99.7% |
| Interquartile Range (IQR) | 1.8% | 1.9% |
| Standard Deviation (Sample) | 1.0% | 1.2% |
| Standard Deviation (Population) | 1.0% | 1.1% |
Demographics Similar to Immigrants from Egypt and Immigrants from Argentina by 1st Grade
In terms of 1st grade, the demographic groups most similar to Immigrants from Egypt are Tohono O'odham (97.8%, a difference of 0.0%), Yuman (97.8%, a difference of 0.010%), Immigrants from Lebanon (97.8%, a difference of 0.010%), Immigrants from Kenya (97.8%, a difference of 0.020%), and Guamanian/Chamorro (97.8%, a difference of 0.020%). Similarly, the demographic groups most similar to Immigrants from Argentina are Egyptian (97.9%, a difference of 0.0%), Immigrants from Poland (97.9%, a difference of 0.0%), Portuguese (97.9%, a difference of 0.010%), Immigrants from Belarus (97.9%, a difference of 0.010%), and Paiute (97.9%, a difference of 0.020%).
| Demographics | Rating | Rank | 1st Grade |
| Portuguese | 44.2 /100 | #181 | Average 97.9% |
| Egyptians | 42.7 /100 | #182 | Average 97.9% |
| Immigrants | Argentina | 41.3 /100 | #183 | Average 97.9% |
| Immigrants | Poland | 40.1 /100 | #184 | Average 97.9% |
| Immigrants | Belarus | 39.3 /100 | #185 | Fair 97.9% |
| Paiute | 36.5 /100 | #186 | Fair 97.9% |
| Pakistanis | 35.8 /100 | #187 | Fair 97.9% |
| Arabs | 35.5 /100 | #188 | Fair 97.9% |
| Immigrants | Kazakhstan | 34.9 /100 | #189 | Fair 97.9% |
| Panamanians | 34.1 /100 | #190 | Fair 97.9% |
| Blacks/African Americans | 30.7 /100 | #191 | Fair 97.9% |
| Paraguayans | 30.2 /100 | #192 | Fair 97.9% |
| Immigrants | Taiwan | 29.4 /100 | #193 | Fair 97.9% |
| Mongolians | 29.2 /100 | #194 | Fair 97.9% |
| Hawaiians | 28.8 /100 | #195 | Fair 97.9% |
| Immigrants | Kenya | 26.3 /100 | #196 | Fair 97.8% |
| Guamanians/Chamorros | 26.2 /100 | #197 | Fair 97.8% |
| Yuman | 24.4 /100 | #198 | Fair 97.8% |
| Tohono O'odham | 23.2 /100 | #199 | Fair 97.8% |
| Immigrants | Egypt | 22.6 /100 | #200 | Fair 97.8% |
| Immigrants | Lebanon | 20.1 /100 | #201 | Fair 97.8% |