Immigrants from Egypt vs Cuban 12th Grade, No Diploma

COMPARE

Immigrants from Egypt
Race
Ancestry
AfghanAfricanAlaska NativeAlaskan AthabascanAlbanianAleutAlsatianAmericanApacheArabArapahoArgentineanArmenianAssyrian/Chaldean/SyriacAustralianAustrianBahamianBangladeshiBarbadianBasqueBelgianBelizeanBermudanBhutaneseBlackfeetBolivianBrazilianBritishBritish West IndianBulgarianBurmeseCajunCambodianCanadianCape VerdeanCarpatho RusynCelticCentral AmericanCentral American IndianCherokeeCheyenneChickasawChileanChineseChippewaChoctawColombianColvilleComancheCosta RicanCreeCreekCroatianCrowCypriotCzechCzechoslovakianDanishDelawareDominicanDutchDutch West IndianEastern EuropeanEcuadorianEgyptianEnglishEstonianEthiopianEuropeanFijianFilipinoFinnishFrenchFrench American IndianFrench CanadianGermanGerman RussianGhanaianGreekGuamanian/ChamorroGuatemalanGuyaneseHaitianHmongHonduranHopiHoumaHungarianIcelanderIndian (Asian)IndonesianInupiatIranianIraqiIrishIroquoisIsraeliItalianJamaicanJapaneseJordanianKenyanKiowaKoreanLaotianLatvianLebaneseLiberianLithuanianLumbeeLuxembourgerMacedonianMalaysianMalteseMarshalleseMenomineeMexicanMexican American IndianMongolianMoroccanNative HawaiianNavajoNepaleseNew ZealanderNicaraguanNigerianNorthern EuropeanNorwegianOkinawanOsageOttawaPaiutePakistaniPalestinianPanamanianParaguayanPennsylvania GermanPeruvianPimaPolishPortuguesePotawatomiPuebloPuerto RicanPuget Sound SalishRomanianRussianSalvadoranSamoanScandinavianScotch-IrishScottishSeminoleSenegaleseSerbianShoshoneSierra LeoneanSiouxSlavicSlovakSloveneSomaliSouth AfricanSouth AmericanSouth American IndianSoviet UnionSpaniardSpanishSpanish AmericanSpanish American IndianSri LankanSubsaharan AfricanSudaneseSwedishSwissSyrianTaiwaneseThaiTlingit-HaidaTohono O'OdhamTonganTrinidadian and TobagonianTsimshianTurkishU.S. Virgin IslanderUgandanUkrainianUruguayanUteVenezuelanVietnameseWelshWest IndianYakamaYaquiYugoslavianYumanYup'ikZimbabwean
Immigration
NonimmigrantsImmigrantsAfghanistanAfricaAlbaniaArgentinaArmeniaAsiaAustraliaAustriaBahamasBangladeshBarbadosBelarusBelgiumBelizeBoliviaBosnia and HerzegovinaBrazilBulgariaBurma/MyanmarCabo VerdeCambodiaCameroonCanadaCaribbeanCentral AmericaChileChinaColombiaCongoCosta RicaCroatiaCubaCzechoslovakiaDenmarkDominicaDominican RepublicEastern AfricaEastern AsiaEastern EuropeEcuadorEgyptEl SalvadorEnglandEritreaEthiopiaEuropeFijiFranceGermanyGhanaGreeceGrenadaGuatemalaGuyanaHaitiHondurasHong KongHungaryIndiaIndonesiaIranIraqIrelandIsraelItalyJamaicaJapanJordanKazakhstanKenyaKoreaKuwaitLaosLatin AmericaLatviaLebanonLiberiaLithuaniaMalaysiaMexicoMicronesiaMiddle AfricaMoldovaMoroccoNepalNetherlandsNicaraguaNigeriaNorth AmericaNorth MacedoniaNorthern AfricaNorthern EuropeNorwayOceaniaPakistanPanamaPeruPhilippinesPolandPortugalRomaniaRussiaSaudi ArabiaScotlandSenegalSerbiaSierra LeoneSingaporeSomaliaSouth AfricaSouth AmericaSouth Central AsiaSouth Eastern AsiaSouthern EuropeSpainSri LankaSt. Vincent and the GrenadinesSudanSwedenSwitzerlandSyriaTaiwanThailandTrinidad and TobagoTurkeyUgandaUkraineUruguayUzbekistanVenezuelaVietnamWest IndiesWestern AfricaWestern AsiaWestern EuropeYemenZaireZimbabweAzores
Cuban
Race
Ancestry
AfghanAfricanAlaska NativeAlaskan AthabascanAlbanianAleutAlsatianAmericanApacheArabArapahoArgentineanArmenianAssyrian/Chaldean/SyriacAustralianAustrianBahamianBangladeshiBarbadianBasqueBelgianBelizeanBermudanBhutaneseBlackfeetBolivianBrazilianBritishBritish West IndianBulgarianBurmeseCajunCambodianCanadianCape VerdeanCarpatho RusynCelticCentral AmericanCentral American IndianCherokeeCheyenneChickasawChileanChineseChippewaChoctawColombianColvilleComancheCosta RicanCreeCreekCroatianCrowCubanCypriotCzechCzechoslovakianDanishDelawareDominicanDutchDutch West IndianEastern EuropeanEcuadorianEgyptianEnglishEstonianEthiopianEuropeanFijianFilipinoFinnishFrenchFrench American IndianFrench CanadianGermanGerman RussianGhanaianGreekGuamanian/ChamorroGuatemalanGuyaneseHaitianHmongHonduranHopiHoumaHungarianIcelanderIndian (Asian)IndonesianInupiatIranianIraqiIrishIroquoisIsraeliItalianJamaicanJapaneseJordanianKenyanKiowaKoreanLaotianLatvianLebaneseLiberianLithuanianLumbeeLuxembourgerMacedonianMalaysianMalteseMarshalleseMenomineeMexicanMexican American IndianMongolianMoroccanNative HawaiianNavajoNepaleseNew ZealanderNicaraguanNigerianNorthern EuropeanNorwegianOkinawanOsageOttawaPaiutePakistaniPalestinianPanamanianParaguayanPennsylvania GermanPeruvianPimaPolishPortuguesePotawatomiPuebloPuerto RicanPuget Sound SalishRomanianRussianSalvadoranSamoanScandinavianScotch-IrishScottishSeminoleSenegaleseSerbianShoshoneSierra LeoneanSiouxSlavicSlovakSloveneSomaliSouth AfricanSouth AmericanSouth American IndianSoviet UnionSpaniardSpanishSpanish AmericanSpanish American IndianSri LankanSubsaharan AfricanSudaneseSwedishSwissSyrianTaiwaneseThaiTlingit-HaidaTohono O'OdhamTonganTrinidadian and TobagonianTsimshianTurkishU.S. Virgin IslanderUgandanUkrainianUruguayanUteVenezuelanVietnameseWelshWest IndianYakamaYaquiYugoslavianYumanYup'ikZimbabwean
Immigration
NonimmigrantsImmigrantsAfghanistanAfricaAlbaniaArgentinaArmeniaAsiaAustraliaAustriaBahamasBangladeshBarbadosBelarusBelgiumBelizeBoliviaBosnia and HerzegovinaBrazilBulgariaBurma/MyanmarCabo VerdeCambodiaCameroonCanadaCaribbeanCentral AmericaChileChinaColombiaCongoCosta RicaCroatiaCubaCzechoslovakiaDenmarkDominicaDominican RepublicEastern AfricaEastern AsiaEastern EuropeEcuadorEl SalvadorEnglandEritreaEthiopiaEuropeFijiFranceGermanyGhanaGreeceGrenadaGuatemalaGuyanaHaitiHondurasHong KongHungaryIndiaIndonesiaIranIraqIrelandIsraelItalyJamaicaJapanJordanKazakhstanKenyaKoreaKuwaitLaosLatin AmericaLatviaLebanonLiberiaLithuaniaMalaysiaMexicoMicronesiaMiddle AfricaMoldovaMoroccoNepalNetherlandsNicaraguaNigeriaNorth AmericaNorth MacedoniaNorthern AfricaNorthern EuropeNorwayOceaniaPakistanPanamaPeruPhilippinesPolandPortugalRomaniaRussiaSaudi ArabiaScotlandSenegalSerbiaSierra LeoneSingaporeSomaliaSouth AfricaSouth AmericaSouth Central AsiaSouth Eastern AsiaSouthern EuropeSpainSri LankaSt. Vincent and the GrenadinesSudanSwedenSwitzerlandSyriaTaiwanThailandTrinidad and TobagoTurkeyUgandaUkraineUruguayUzbekistanVenezuelaVietnamWest IndiesWestern AfricaWestern AsiaWestern EuropeYemenZaireZimbabweAzores
12th Grade, No Diploma
Income
Poverty
Unemployment
Labor Participation
Family Structure
Vehicle Availability
Education Level
Disability

12th Grade, No Diploma Comparison

Immigrants from Egypt

Cubans

Excellent
Tragic
91.6%
12TH GRADE, NO DIPLOMA
83.9/ 100
METRIC RATING
139th/ 347
METRIC RANK
88.9%
12TH GRADE, NO DIPLOMA
0.0/ 100
METRIC RATING
281st/ 347
METRIC RANK

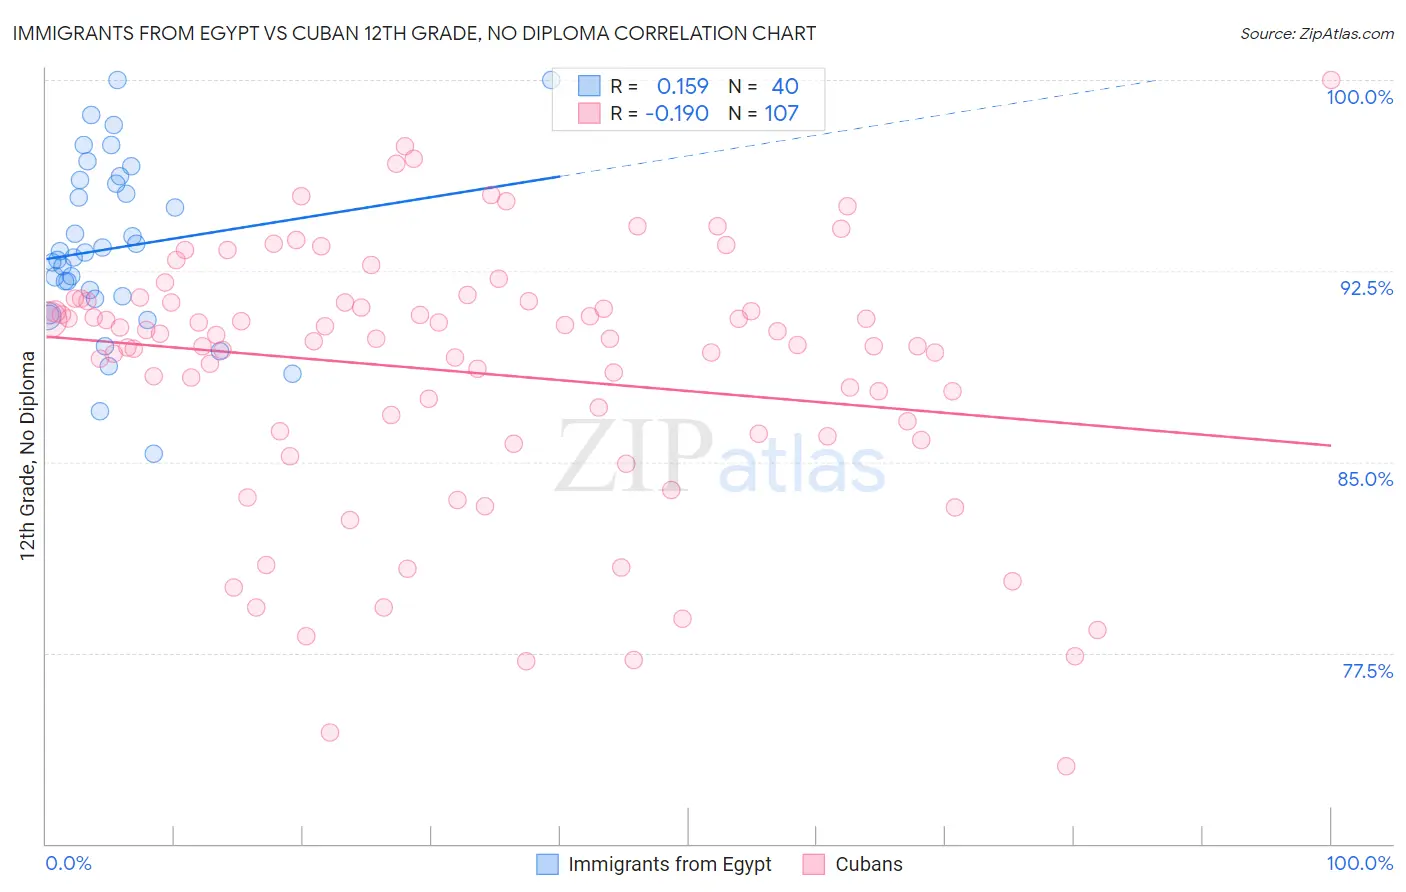
Immigrants from Egypt vs Cuban 12th Grade, No Diploma Correlation Chart

The statistical analysis conducted on geographies consisting of 245,484,455 people shows a poor positive correlation between the proportion of Immigrants from Egypt and percentage of population with at least 12th grade (no diploma) education in the United States with a correlation coefficient (R) of 0.159 and weighted average of 91.6%. Similarly, the statistical analysis conducted on geographies consisting of 449,351,555 people shows a poor negative correlation between the proportion of Cubans and percentage of population with at least 12th grade (no diploma) education in the United States with a correlation coefficient (R) of -0.190 and weighted average of 88.9%, a difference of 3.1%.
Immigrants from Egypt vs Cuban 12th Grade, No Diploma

12th Grade, No Diploma Correlation Summary

MeasurementImmigrants from EgyptCuban
Minimum85.3%73.0%
Maximum100.0%100.0%
Range14.7%27.0%
Mean93.4%88.5%
Median93.1%89.8%
Interquartile 25% (IQ1)91.4%86.1%
Interquartile 75% (IQ3)96.0%91.3%
Interquartile Range (IQR)4.5%5.2%
Standard Deviation (Sample)3.4%5.2%
Standard Deviation (Population)3.3%5.2%

Similar Demographics by 12th Grade, No Diploma

Demographics Similar to Immigrants from Egypt by 12th Grade, No Diploma

In terms of 12th grade, no diploma, the demographic groups most similar to Immigrants from Egypt are Arab (91.6%, a difference of 0.0%), Alaska Native (91.6%, a difference of 0.020%), Immigrants from Poland (91.6%, a difference of 0.030%), Argentinean (91.6%, a difference of 0.040%), and Chilean (91.7%, a difference of 0.050%).
DemographicsRating | Rank12th Grade, No Diploma
Immigrants | Eastern Asia
89.3
/100
|
#132
Excellent
91.8%
Immigrants | Italy
88.3
/100
|
#133
Excellent
91.7%
Venezuelans
88.2
/100
|
#134
Excellent
91.7%
Immigrants | Bosnia and Herzegovina
87.3
/100
|
#135
Excellent
91.7%
Chileans
85.8
/100
|
#136
Excellent
91.7%
Alaska Natives
84.9
/100
|
#137
Excellent
91.6%
Arabs
84.1
/100
|
#138
Excellent
91.6%
Immigrants | Egypt
83.9
/100
|
#139
Excellent
91.6%
Immigrants | Poland
82.3
/100
|
#140
Excellent
91.6%
Argentineans
82.0
/100
|
#141
Excellent
91.6%
Immigrants | Venezuela
80.9
/100
|
#142
Excellent
91.6%
Immigrants | Argentina
80.7
/100
|
#143
Excellent
91.6%
Immigrants | Spain
80.1
/100
|
#144
Excellent
91.6%
Immigrants | Lebanon
80.0
/100
|
#145
Excellent
91.6%
Immigrants | Brazil
79.8
/100
|
#146
Good
91.5%

Demographics Similar to Cubans by 12th Grade, No Diploma

In terms of 12th grade, no diploma, the demographic groups most similar to Cubans are Immigrants from Laos (88.9%, a difference of 0.010%), Immigrants from Burma/Myanmar (88.9%, a difference of 0.010%), Immigrants from St. Vincent and the Grenadines (88.9%, a difference of 0.080%), Immigrants from Barbados (89.0%, a difference of 0.15%), and Immigrants from Vietnam (88.7%, a difference of 0.17%).
DemographicsRating | Rank12th Grade, No Diploma
Cajuns
0.1
/100
|
#274
Tragic
89.1%
Immigrants | Congo
0.1
/100
|
#275
Tragic
89.0%
Ute
0.1
/100
|
#276
Tragic
89.0%
Immigrants | Barbados
0.0
/100
|
#277
Tragic
89.0%
Immigrants | St. Vincent and the Grenadines
0.0
/100
|
#278
Tragic
88.9%
Immigrants | Laos
0.0
/100
|
#279
Tragic
88.9%
Immigrants | Burma/Myanmar
0.0
/100
|
#280
Tragic
88.9%
Cubans
0.0
/100
|
#281
Tragic
88.9%
Immigrants | Vietnam
0.0
/100
|
#282
Tragic
88.7%
Paiute
0.0
/100
|
#283
Tragic
88.7%
Pennsylvania Germans
0.0
/100
|
#284
Tragic
88.7%
Indonesians
0.0
/100
|
#285
Tragic
88.6%
Immigrants | West Indies
0.0
/100
|
#286
Tragic
88.6%
Hopi
0.0
/100
|
#287
Tragic
88.6%
Immigrants | Fiji
0.0
/100
|
#288
Tragic
88.6%