Immigrants from Eastern Europe vs Swedish High School Diploma
COMPARE
Immigrants from Eastern Europe
Swedish
High School Diploma
High School Diploma Comparison
Immigrants from Eastern Europe
Swedes
90.1%
HIGH SCHOOL DIPLOMA
94.9/ 100
METRIC RATING
119th/ 347
METRIC RANK
92.2%
HIGH SCHOOL DIPLOMA
100.0/ 100
METRIC RATING
2nd/ 347
METRIC RANK
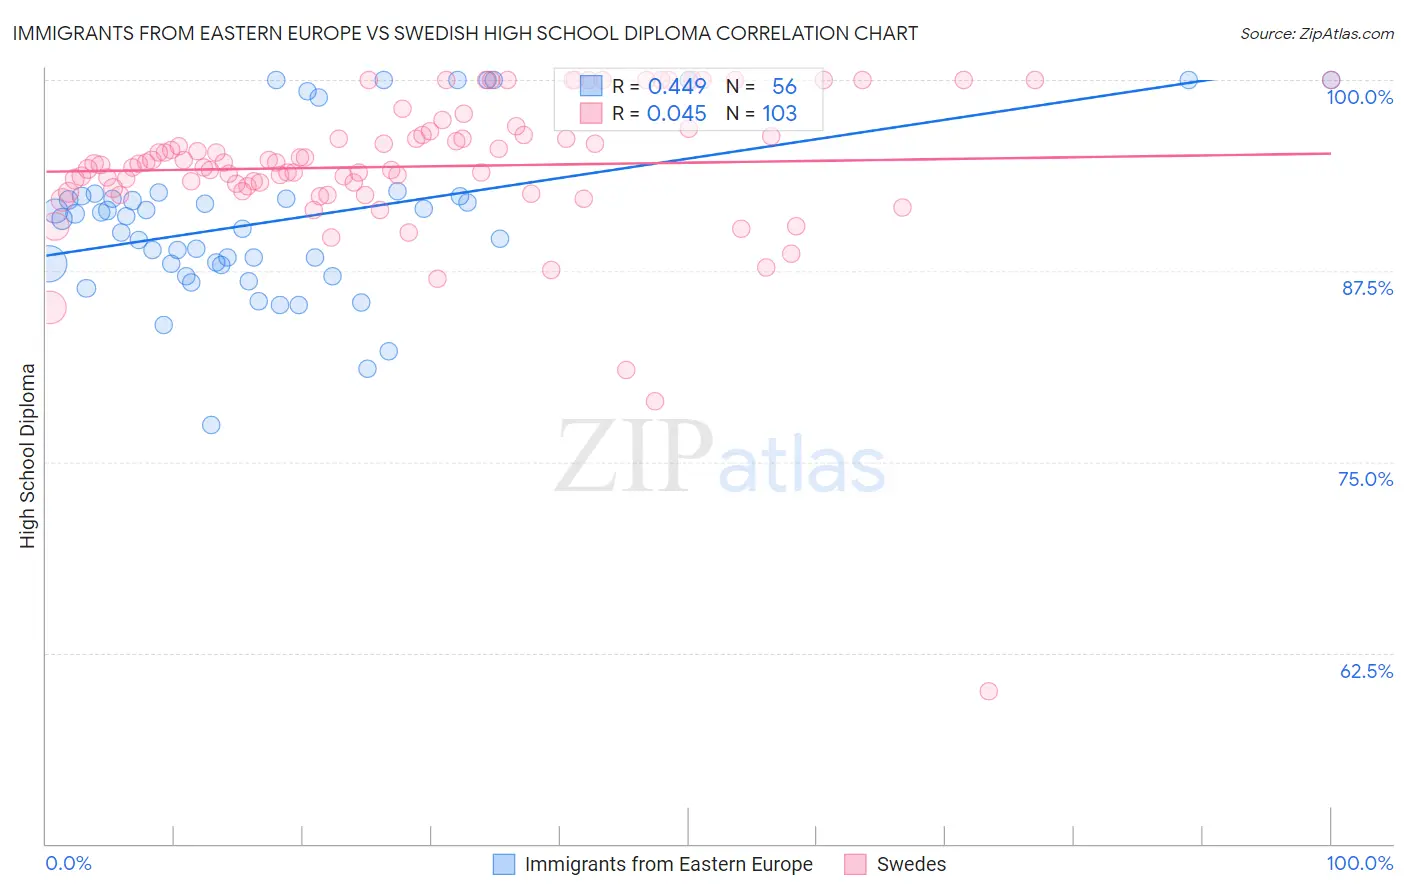
Immigrants from Eastern Europe vs Swedish High School Diploma Correlation Chart
The statistical analysis conducted on geographies consisting of 475,879,420 people shows a moderate positive correlation between the proportion of Immigrants from Eastern Europe and percentage of population with at least high school diploma education in the United States with a correlation coefficient (R) of 0.449 and weighted average of 90.1%. Similarly, the statistical analysis conducted on geographies consisting of 539,231,691 people shows no correlation between the proportion of Swedes and percentage of population with at least high school diploma education in the United States with a correlation coefficient (R) of 0.045 and weighted average of 92.2%, a difference of 2.3%.
High School Diploma Correlation Summary
| Measurement | Immigrants from Eastern Europe | Swedish |
| Minimum | 77.4% | 60.0% |
| Maximum | 100.0% | 100.0% |
| Range | 22.6% | 40.0% |
| Mean | 90.8% | 94.3% |
| Median | 91.0% | 94.5% |
| Interquartile 25% (IQ1) | 87.9% | 92.9% |
| Interquartile 75% (IQ3) | 92.4% | 96.6% |
| Interquartile Range (IQR) | 4.5% | 3.7% |
| Standard Deviation (Sample) | 5.2% | 5.2% |
| Standard Deviation (Population) | 5.2% | 5.2% |
Similar Demographics by High School Diploma
Demographics Similar to Immigrants from Eastern Europe by High School Diploma
In terms of high school diploma, the demographic groups most similar to Immigrants from Eastern Europe are Israeli (90.1%, a difference of 0.020%), Ottawa (90.1%, a difference of 0.030%), Jordanian (90.2%, a difference of 0.040%), White/Caucasian (90.1%, a difference of 0.060%), and Immigrants from Germany (90.2%, a difference of 0.070%).
| Demographics | Rating | Rank | High School Diploma |
| Immigrants | Belarus | 96.4 /100 | #112 | Exceptional 90.2% |
| Immigrants | Sri Lanka | 96.3 /100 | #113 | Exceptional 90.2% |
| Yugoslavians | 96.2 /100 | #114 | Exceptional 90.2% |
| Immigrants | Hungary | 95.8 /100 | #115 | Exceptional 90.2% |
| Immigrants | Germany | 95.7 /100 | #116 | Exceptional 90.2% |
| Jordanians | 95.4 /100 | #117 | Exceptional 90.2% |
| Israelis | 95.1 /100 | #118 | Exceptional 90.1% |
| Immigrants | Eastern Europe | 94.9 /100 | #119 | Exceptional 90.1% |
| Ottawa | 94.4 /100 | #120 | Exceptional 90.1% |
| Whites/Caucasians | 94.1 /100 | #121 | Exceptional 90.1% |
| Immigrants | Kazakhstan | 93.4 /100 | #122 | Exceptional 90.0% |
| German Russians | 92.0 /100 | #123 | Exceptional 90.0% |
| Mongolians | 91.6 /100 | #124 | Exceptional 89.9% |
| Egyptians | 91.1 /100 | #125 | Exceptional 89.9% |
| Alaska Natives | 91.0 /100 | #126 | Exceptional 89.9% |
Demographics Similar to Swedes by High School Diploma
In terms of high school diploma, the demographic groups most similar to Swedes are Carpatho Rusyn (92.1%, a difference of 0.10%), Lithuanian (92.0%, a difference of 0.15%), Slovene (92.0%, a difference of 0.16%), Slovak (92.0%, a difference of 0.18%), and Immigrants from India (92.0%, a difference of 0.18%).
| Demographics | Rating | Rank | High School Diploma |
| Norwegians | 100.0 /100 | #1 | Exceptional 92.5% |
| Swedes | 100.0 /100 | #2 | Exceptional 92.2% |
| Carpatho Rusyns | 100.0 /100 | #3 | Exceptional 92.1% |
| Lithuanians | 100.0 /100 | #4 | Exceptional 92.0% |
| Slovenes | 100.0 /100 | #5 | Exceptional 92.0% |
| Slovaks | 100.0 /100 | #6 | Exceptional 92.0% |
| Immigrants | India | 100.0 /100 | #7 | Exceptional 92.0% |
| Chinese | 100.0 /100 | #8 | Exceptional 92.0% |
| Latvians | 100.0 /100 | #9 | Exceptional 92.0% |
| Croatians | 100.0 /100 | #10 | Exceptional 92.0% |
| Eastern Europeans | 100.0 /100 | #11 | Exceptional 91.9% |
| Poles | 100.0 /100 | #12 | Exceptional 91.9% |
| Danes | 100.0 /100 | #13 | Exceptional 91.8% |
| Bulgarians | 100.0 /100 | #14 | Exceptional 91.8% |
| Luxembourgers | 100.0 /100 | #15 | Exceptional 91.7% |