Immigrants from Eastern Europe vs Potawatomi 3rd Grade

COMPARE

Immigrants from Eastern Europe
Race
Ancestry
AfghanAfricanAlaska NativeAlaskan AthabascanAlbanianAleutAlsatianAmericanApacheArabArapahoArgentineanArmenianAssyrian/Chaldean/SyriacAustralianAustrianBahamianBangladeshiBarbadianBasqueBelgianBelizeanBermudanBhutaneseBlackfeetBolivianBrazilianBritishBritish West IndianBulgarianBurmeseCajunCambodianCanadianCape VerdeanCarpatho RusynCelticCentral AmericanCentral American IndianCherokeeCheyenneChickasawChileanChineseChippewaChoctawColombianColvilleComancheCosta RicanCreeCreekCroatianCrowCubanCypriotCzechCzechoslovakianDanishDelawareDominicanDutchDutch West IndianEastern EuropeanEcuadorianEgyptianEnglishEstonianEthiopianEuropeanFijianFilipinoFinnishFrenchFrench American IndianFrench CanadianGermanGerman RussianGhanaianGreekGuamanian/ChamorroGuatemalanGuyaneseHaitianHmongHonduranHopiHoumaHungarianIcelanderIndian (Asian)IndonesianInupiatIranianIraqiIrishIroquoisIsraeliItalianJamaicanJapaneseJordanianKenyanKiowaKoreanLaotianLatvianLebaneseLiberianLithuanianLumbeeLuxembourgerMacedonianMalaysianMalteseMarshalleseMenomineeMexicanMexican American IndianMongolianMoroccanNative HawaiianNavajoNepaleseNew ZealanderNicaraguanNigerianNorthern EuropeanNorwegianOkinawanOsageOttawaPaiutePakistaniPalestinianPanamanianParaguayanPennsylvania GermanPeruvianPimaPolishPortuguesePuebloPuerto RicanPuget Sound SalishRomanianRussianSalvadoranSamoanScandinavianScotch-IrishScottishSeminoleSenegaleseSerbianShoshoneSierra LeoneanSiouxSlavicSlovakSloveneSomaliSouth AfricanSouth AmericanSouth American IndianSoviet UnionSpaniardSpanishSpanish AmericanSpanish American IndianSri LankanSubsaharan AfricanSudaneseSwedishSwissSyrianTaiwaneseThaiTlingit-HaidaTohono O'OdhamTonganTrinidadian and TobagonianTsimshianTurkishU.S. Virgin IslanderUgandanUkrainianUruguayanUteVenezuelanVietnameseWelshWest IndianYakamaYaquiYugoslavianYumanYup'ikZimbabwean
Immigration
NonimmigrantsImmigrantsAfghanistanAfricaAlbaniaArgentinaArmeniaAsiaAustraliaAustriaBahamasBangladeshBarbadosBelarusBelgiumBelizeBoliviaBosnia and HerzegovinaBrazilBulgariaBurma/MyanmarCabo VerdeCambodiaCameroonCanadaCaribbeanCentral AmericaChileChinaColombiaCongoCosta RicaCroatiaCubaCzechoslovakiaDenmarkDominicaDominican RepublicEastern AfricaEastern AsiaEastern EuropeEcuadorEgyptEl SalvadorEnglandEritreaEthiopiaEuropeFijiFranceGermanyGhanaGreeceGrenadaGuatemalaGuyanaHaitiHondurasHong KongHungaryIndiaIndonesiaIranIraqIrelandIsraelItalyJamaicaJapanJordanKazakhstanKenyaKoreaKuwaitLaosLatin AmericaLatviaLebanonLiberiaLithuaniaMalaysiaMexicoMicronesiaMiddle AfricaMoldovaMoroccoNepalNetherlandsNicaraguaNigeriaNorth AmericaNorth MacedoniaNorthern AfricaNorthern EuropeNorwayOceaniaPakistanPanamaPeruPhilippinesPolandPortugalRomaniaRussiaSaudi ArabiaScotlandSenegalSerbiaSierra LeoneSingaporeSomaliaSouth AfricaSouth AmericaSouth Central AsiaSouth Eastern AsiaSouthern EuropeSpainSri LankaSt. Vincent and the GrenadinesSudanSwedenSwitzerlandSyriaTaiwanThailandTrinidad and TobagoTurkeyUgandaUkraineUruguayUzbekistanVenezuelaVietnamWest IndiesWestern AfricaWestern AsiaWestern EuropeYemenZaireZimbabweAzores
Potawatomi
Race
Ancestry
AfghanAfricanAlaska NativeAlaskan AthabascanAlbanianAleutAlsatianAmericanApacheArabArapahoArgentineanArmenianAssyrian/Chaldean/SyriacAustralianAustrianBahamianBangladeshiBarbadianBasqueBelgianBelizeanBermudanBhutaneseBlackfeetBolivianBrazilianBritishBritish West IndianBulgarianBurmeseCajunCambodianCanadianCape VerdeanCarpatho RusynCelticCentral AmericanCentral American IndianCherokeeCheyenneChickasawChileanChineseChippewaChoctawColombianColvilleComancheCosta RicanCreeCreekCroatianCrowCubanCypriotCzechCzechoslovakianDanishDelawareDominicanDutchDutch West IndianEastern EuropeanEcuadorianEgyptianEnglishEstonianEthiopianEuropeanFijianFilipinoFinnishFrenchFrench American IndianFrench CanadianGermanGerman RussianGhanaianGreekGuamanian/ChamorroGuatemalanGuyaneseHaitianHmongHonduranHopiHoumaHungarianIcelanderIndian (Asian)IndonesianInupiatIranianIraqiIrishIroquoisIsraeliItalianJamaicanJapaneseJordanianKenyanKiowaKoreanLaotianLatvianLebaneseLiberianLithuanianLumbeeLuxembourgerMacedonianMalaysianMalteseMarshalleseMenomineeMexicanMexican American IndianMongolianMoroccanNative HawaiianNavajoNepaleseNew ZealanderNicaraguanNigerianNorthern EuropeanNorwegianOkinawanOsageOttawaPaiutePakistaniPalestinianPanamanianParaguayanPennsylvania GermanPeruvianPimaPolishPortuguesePotawatomiPuebloPuerto RicanPuget Sound SalishRomanianRussianSalvadoranSamoanScandinavianScotch-IrishScottishSeminoleSenegaleseSerbianShoshoneSierra LeoneanSiouxSlavicSlovakSloveneSomaliSouth AfricanSouth AmericanSouth American IndianSoviet UnionSpaniardSpanishSpanish AmericanSpanish American IndianSri LankanSubsaharan AfricanSudaneseSwedishSwissSyrianTaiwaneseThaiTlingit-HaidaTohono O'OdhamTonganTrinidadian and TobagonianTsimshianTurkishU.S. Virgin IslanderUgandanUkrainianUruguayanUteVenezuelanVietnameseWelshWest IndianYakamaYaquiYugoslavianYumanYup'ikZimbabwean
Immigration
NonimmigrantsImmigrantsAfghanistanAfricaAlbaniaArgentinaArmeniaAsiaAustraliaAustriaBahamasBangladeshBarbadosBelarusBelgiumBelizeBoliviaBosnia and HerzegovinaBrazilBulgariaBurma/MyanmarCabo VerdeCambodiaCameroonCanadaCaribbeanCentral AmericaChileChinaColombiaCongoCosta RicaCroatiaCubaCzechoslovakiaDenmarkDominicaDominican RepublicEastern AfricaEastern AsiaEcuadorEgyptEl SalvadorEnglandEritreaEthiopiaEuropeFijiFranceGermanyGhanaGreeceGrenadaGuatemalaGuyanaHaitiHondurasHong KongHungaryIndiaIndonesiaIranIraqIrelandIsraelItalyJamaicaJapanJordanKazakhstanKenyaKoreaKuwaitLaosLatin AmericaLatviaLebanonLiberiaLithuaniaMalaysiaMexicoMicronesiaMiddle AfricaMoldovaMoroccoNepalNetherlandsNicaraguaNigeriaNorth AmericaNorth MacedoniaNorthern AfricaNorthern EuropeNorwayOceaniaPakistanPanamaPeruPhilippinesPolandPortugalRomaniaRussiaSaudi ArabiaScotlandSenegalSerbiaSierra LeoneSingaporeSomaliaSouth AfricaSouth AmericaSouth Central AsiaSouth Eastern AsiaSouthern EuropeSpainSri LankaSt. Vincent and the GrenadinesSudanSwedenSwitzerlandSyriaTaiwanThailandTrinidad and TobagoTurkeyUgandaUkraineUruguayUzbekistanVenezuelaVietnamWest IndiesWestern AfricaWestern AsiaWestern EuropeYemenZaireZimbabweAzores
3rd Grade
Income
Poverty
Unemployment
Labor Participation
Family Structure
Vehicle Availability
Education Level
Disability

3rd Grade Comparison

Immigrants from Eastern Europe

Potawatomi

Good
Exceptional
97.8%
3RD GRADE
64.1/ 100
METRIC RATING
154th/ 347
METRIC RANK
98.1%
3RD GRADE
98.9/ 100
METRIC RATING
86th/ 347
METRIC RANK

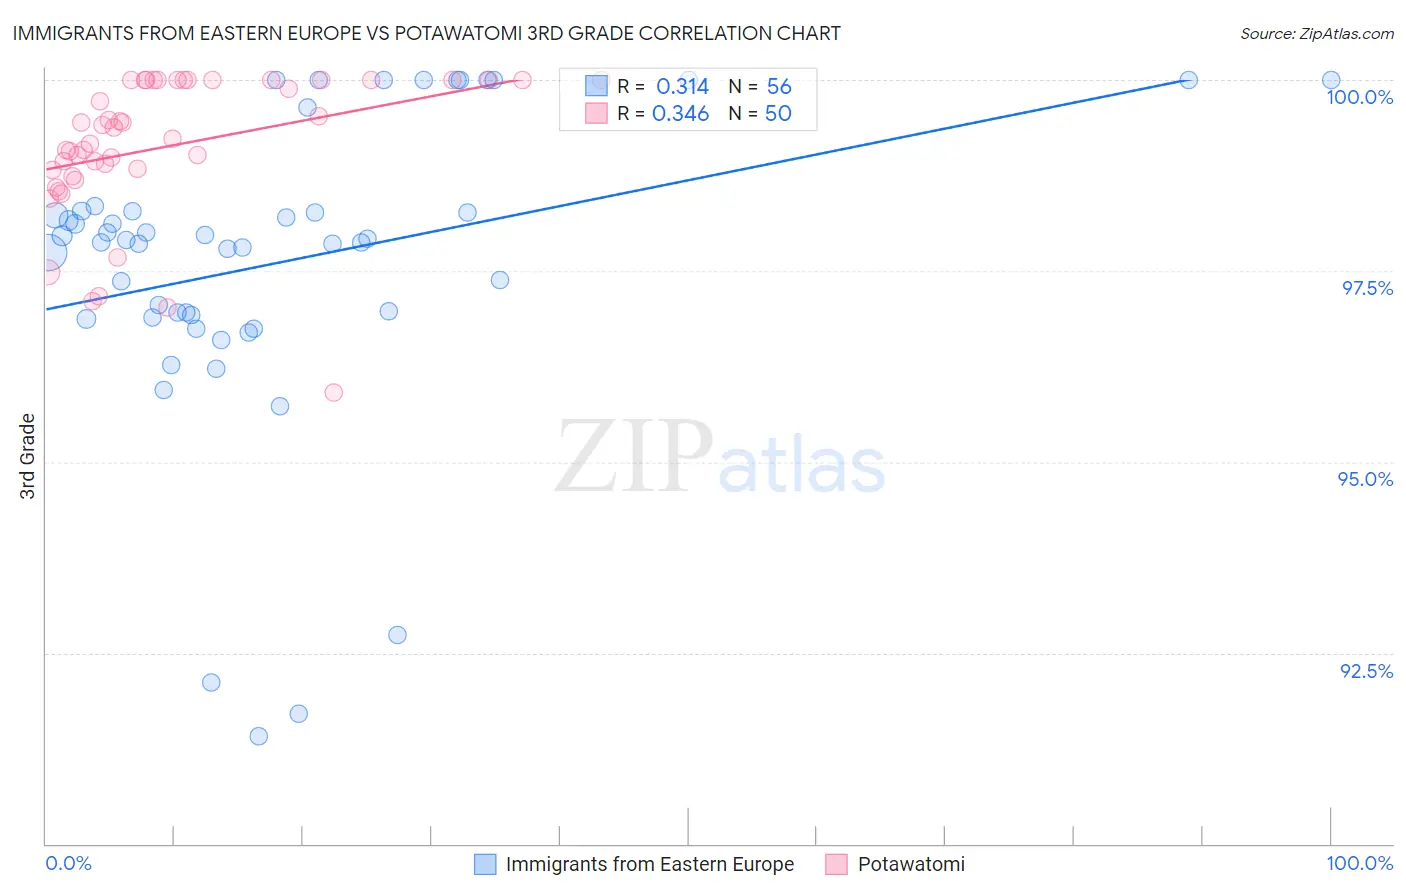
Immigrants from Eastern Europe vs Potawatomi 3rd Grade Correlation Chart

The statistical analysis conducted on geographies consisting of 475,879,420 people shows a mild positive correlation between the proportion of Immigrants from Eastern Europe and percentage of population with at least 3rd grade education in the United States with a correlation coefficient (R) of 0.314 and weighted average of 97.8%. Similarly, the statistical analysis conducted on geographies consisting of 117,769,196 people shows a mild positive correlation between the proportion of Potawatomi and percentage of population with at least 3rd grade education in the United States with a correlation coefficient (R) of 0.346 and weighted average of 98.1%, a difference of 0.33%.
Immigrants from Eastern Europe vs Potawatomi 3rd Grade

3rd Grade Correlation Summary

MeasurementImmigrants from Eastern EuropePotawatomi
Minimum91.4%95.9%
Maximum100.0%100.0%
Range8.6%4.1%
Mean97.6%99.1%
Median97.9%99.3%
Interquartile 25% (IQ1)96.9%98.8%
Interquartile 75% (IQ3)98.3%100.0%
Interquartile Range (IQR)1.4%1.2%
Standard Deviation (Sample)2.0%0.94%
Standard Deviation (Population)2.0%0.93%

Similar Demographics by 3rd Grade

Demographics Similar to Immigrants from Eastern Europe by 3rd Grade

In terms of 3rd grade, the demographic groups most similar to Immigrants from Eastern Europe are Bermudan (97.8%, a difference of 0.010%), Immigrants from Russia (97.8%, a difference of 0.010%), Immigrants from Italy (97.8%, a difference of 0.010%), Venezuelan (97.8%, a difference of 0.010%), and French American Indian (97.8%, a difference of 0.010%).
DemographicsRating | Rank3rd Grade
Immigrants | Israel
77.3
/100
|
#147
Good
97.9%
Immigrants | Moldova
77.1
/100
|
#148
Good
97.9%
Immigrants | North Macedonia
74.5
/100
|
#149
Good
97.8%
Jordanians
74.5
/100
|
#150
Good
97.8%
Soviet Union
72.6
/100
|
#151
Good
97.8%
Immigrants | South Central Asia
69.5
/100
|
#152
Good
97.8%
Apache
68.5
/100
|
#153
Good
97.8%
Immigrants | Eastern Europe
64.1
/100
|
#154
Good
97.8%
Bermudans
62.6
/100
|
#155
Good
97.8%
Immigrants | Russia
61.7
/100
|
#156
Good
97.8%
Immigrants | Italy
61.2
/100
|
#157
Good
97.8%
Venezuelans
60.9
/100
|
#158
Good
97.8%
French American Indians
60.0
/100
|
#159
Average
97.8%
Immigrants | Iran
59.1
/100
|
#160
Average
97.8%
Albanians
58.8
/100
|
#161
Average
97.8%

Demographics Similar to Potawatomi by 3rd Grade

In terms of 3rd grade, the demographic groups most similar to Potawatomi are Immigrants from Sweden (98.1%, a difference of 0.0%), Immigrants from Australia (98.1%, a difference of 0.0%), Immigrants from Denmark (98.1%, a difference of 0.0%), Immigrants from India (98.1%, a difference of 0.0%), and Delaware (98.1%, a difference of 0.0%).
DemographicsRating | Rank3rd Grade
Immigrants | Belgium
99.1
/100
|
#79
Exceptional
98.1%
Macedonians
99.1
/100
|
#80
Exceptional
98.1%
Icelanders
99.1
/100
|
#81
Exceptional
98.1%
Shoshone
99.0
/100
|
#82
Exceptional
98.1%
Ukrainians
98.9
/100
|
#83
Exceptional
98.1%
Immigrants | Sweden
98.9
/100
|
#84
Exceptional
98.1%
Immigrants | Australia
98.9
/100
|
#85
Exceptional
98.1%
Potawatomi
98.9
/100
|
#86
Exceptional
98.1%
Immigrants | Denmark
98.8
/100
|
#87
Exceptional
98.1%
Immigrants | India
98.8
/100
|
#88
Exceptional
98.1%
Delaware
98.8
/100
|
#89
Exceptional
98.1%
Zimbabweans
98.8
/100
|
#90
Exceptional
98.1%
Hopi
98.7
/100
|
#91
Exceptional
98.1%
Immigrants | South Africa
98.7
/100
|
#92
Exceptional
98.1%
Immigrants | Western Europe
98.7
/100
|
#93
Exceptional
98.1%