Immigrants from Eastern Africa vs Paraguayan 4th Grade

COMPARE

Immigrants from Eastern Africa
Race
Ancestry
AfghanAfricanAlaska NativeAlaskan AthabascanAlbanianAleutAlsatianAmericanApacheArabArapahoArgentineanArmenianAssyrian/Chaldean/SyriacAustralianAustrianBahamianBangladeshiBarbadianBasqueBelgianBelizeanBermudanBhutaneseBlackfeetBolivianBrazilianBritishBritish West IndianBulgarianBurmeseCajunCambodianCanadianCape VerdeanCarpatho RusynCelticCentral AmericanCentral American IndianCherokeeCheyenneChickasawChileanChineseChippewaChoctawColombianColvilleComancheCosta RicanCreeCreekCroatianCrowCubanCypriotCzechCzechoslovakianDanishDelawareDominicanDutchDutch West IndianEastern EuropeanEcuadorianEgyptianEnglishEstonianEthiopianEuropeanFijianFilipinoFinnishFrenchFrench American IndianFrench CanadianGermanGerman RussianGhanaianGreekGuamanian/ChamorroGuatemalanGuyaneseHaitianHmongHonduranHopiHoumaHungarianIcelanderIndian (Asian)IndonesianInupiatIranianIraqiIrishIroquoisIsraeliItalianJamaicanJapaneseJordanianKenyanKiowaKoreanLaotianLatvianLebaneseLiberianLithuanianLumbeeLuxembourgerMacedonianMalaysianMalteseMarshalleseMenomineeMexicanMexican American IndianMongolianMoroccanNative HawaiianNavajoNepaleseNew ZealanderNicaraguanNigerianNorthern EuropeanNorwegianOkinawanOsageOttawaPaiutePakistaniPalestinianPanamanianPennsylvania GermanPeruvianPimaPolishPortuguesePotawatomiPuebloPuerto RicanPuget Sound SalishRomanianRussianSalvadoranSamoanScandinavianScotch-IrishScottishSeminoleSenegaleseSerbianShoshoneSierra LeoneanSiouxSlavicSlovakSloveneSomaliSouth AfricanSouth AmericanSouth American IndianSoviet UnionSpaniardSpanishSpanish AmericanSpanish American IndianSri LankanSubsaharan AfricanSudaneseSwedishSwissSyrianTaiwaneseThaiTlingit-HaidaTohono O'OdhamTonganTrinidadian and TobagonianTsimshianTurkishU.S. Virgin IslanderUgandanUkrainianUruguayanUteVenezuelanVietnameseWelshWest IndianYakamaYaquiYugoslavianYumanYup'ikZimbabwean
Immigration
NonimmigrantsImmigrantsAfghanistanAfricaAlbaniaArgentinaArmeniaAsiaAustraliaAustriaBahamasBangladeshBarbadosBelarusBelgiumBelizeBoliviaBosnia and HerzegovinaBrazilBulgariaBurma/MyanmarCabo VerdeCambodiaCameroonCanadaCaribbeanCentral AmericaChileChinaColombiaCongoCosta RicaCroatiaCubaCzechoslovakiaDenmarkDominicaDominican RepublicEastern AfricaEastern AsiaEastern EuropeEcuadorEgyptEl SalvadorEnglandEritreaEthiopiaEuropeFijiFranceGermanyGhanaGreeceGrenadaGuatemalaGuyanaHaitiHondurasHong KongHungaryIndiaIndonesiaIranIraqIrelandIsraelItalyJamaicaJapanJordanKazakhstanKenyaKoreaKuwaitLaosLatin AmericaLatviaLebanonLiberiaLithuaniaMalaysiaMexicoMicronesiaMiddle AfricaMoldovaMoroccoNepalNetherlandsNicaraguaNigeriaNorth AmericaNorth MacedoniaNorthern AfricaNorthern EuropeNorwayOceaniaPakistanPanamaPeruPhilippinesPolandPortugalRomaniaRussiaSaudi ArabiaScotlandSenegalSerbiaSierra LeoneSingaporeSomaliaSouth AfricaSouth AmericaSouth Central AsiaSouth Eastern AsiaSouthern EuropeSpainSri LankaSt. Vincent and the GrenadinesSudanSwedenSwitzerlandSyriaTaiwanThailandTrinidad and TobagoTurkeyUgandaUkraineUruguayUzbekistanVenezuelaVietnamWest IndiesWestern AfricaWestern AsiaWestern EuropeYemenZaireZimbabweAzores
Paraguayan
Race
Ancestry
AfghanAfricanAlaska NativeAlaskan AthabascanAlbanianAleutAlsatianAmericanApacheArabArapahoArgentineanArmenianAssyrian/Chaldean/SyriacAustralianAustrianBahamianBangladeshiBarbadianBasqueBelgianBelizeanBermudanBhutaneseBlackfeetBolivianBrazilianBritishBritish West IndianBulgarianBurmeseCajunCambodianCanadianCape VerdeanCarpatho RusynCelticCentral AmericanCentral American IndianCherokeeCheyenneChickasawChileanChineseChippewaChoctawColombianColvilleComancheCosta RicanCreeCreekCroatianCrowCubanCypriotCzechCzechoslovakianDanishDelawareDominicanDutchDutch West IndianEastern EuropeanEcuadorianEgyptianEnglishEstonianEthiopianEuropeanFijianFilipinoFinnishFrenchFrench American IndianFrench CanadianGermanGerman RussianGhanaianGreekGuamanian/ChamorroGuatemalanGuyaneseHaitianHmongHonduranHopiHoumaHungarianIcelanderIndian (Asian)IndonesianInupiatIranianIraqiIrishIroquoisIsraeliItalianJamaicanJapaneseJordanianKenyanKiowaKoreanLaotianLatvianLebaneseLiberianLithuanianLumbeeLuxembourgerMacedonianMalaysianMalteseMarshalleseMenomineeMexicanMexican American IndianMongolianMoroccanNative HawaiianNavajoNepaleseNew ZealanderNicaraguanNigerianNorthern EuropeanNorwegianOkinawanOsageOttawaPaiutePakistaniPalestinianPanamanianParaguayanPennsylvania GermanPeruvianPimaPolishPortuguesePotawatomiPuebloPuerto RicanPuget Sound SalishRomanianRussianSalvadoranSamoanScandinavianScotch-IrishScottishSeminoleSenegaleseSerbianShoshoneSierra LeoneanSiouxSlavicSlovakSloveneSomaliSouth AfricanSouth AmericanSouth American IndianSoviet UnionSpaniardSpanishSpanish AmericanSpanish American IndianSri LankanSubsaharan AfricanSudaneseSwedishSwissSyrianTaiwaneseThaiTlingit-HaidaTohono O'OdhamTonganTrinidadian and TobagonianTsimshianTurkishU.S. Virgin IslanderUgandanUkrainianUruguayanUteVenezuelanVietnameseWelshWest IndianYakamaYaquiYugoslavianYumanYup'ikZimbabwean
Immigration
NonimmigrantsImmigrantsAfghanistanAfricaAlbaniaArgentinaArmeniaAsiaAustraliaAustriaBahamasBangladeshBarbadosBelarusBelgiumBelizeBoliviaBosnia and HerzegovinaBrazilBulgariaBurma/MyanmarCabo VerdeCambodiaCameroonCanadaCaribbeanCentral AmericaChileChinaColombiaCongoCosta RicaCroatiaCubaCzechoslovakiaDenmarkDominicaDominican RepublicEastern AsiaEastern EuropeEcuadorEgyptEl SalvadorEnglandEritreaEthiopiaEuropeFijiFranceGermanyGhanaGreeceGrenadaGuatemalaGuyanaHaitiHondurasHong KongHungaryIndiaIndonesiaIranIraqIrelandIsraelItalyJamaicaJapanJordanKazakhstanKenyaKoreaKuwaitLaosLatin AmericaLatviaLebanonLiberiaLithuaniaMalaysiaMexicoMicronesiaMiddle AfricaMoldovaMoroccoNepalNetherlandsNicaraguaNigeriaNorth AmericaNorth MacedoniaNorthern AfricaNorthern EuropeNorwayOceaniaPakistanPanamaPeruPhilippinesPolandPortugalRomaniaRussiaSaudi ArabiaScotlandSenegalSerbiaSierra LeoneSingaporeSomaliaSouth AfricaSouth AmericaSouth Central AsiaSouth Eastern AsiaSouthern EuropeSpainSri LankaSt. Vincent and the GrenadinesSudanSwedenSwitzerlandSyriaTaiwanThailandTrinidad and TobagoTurkeyUgandaUkraineUruguayUzbekistanVenezuelaVietnamWest IndiesWestern AfricaWestern AsiaWestern EuropeYemenZaireZimbabweAzores
4th Grade
Income
Poverty
Unemployment
Labor Participation
Family Structure
Vehicle Availability
Education Level
Disability

4th Grade Comparison

Immigrants from Eastern Africa

Paraguayans

Tragic
Fair
97.1%
4TH GRADE
1.2/ 100
METRIC RATING
245th/ 347
METRIC RANK
97.4%
4TH GRADE
28.9/ 100
METRIC RATING
195th/ 347
METRIC RANK

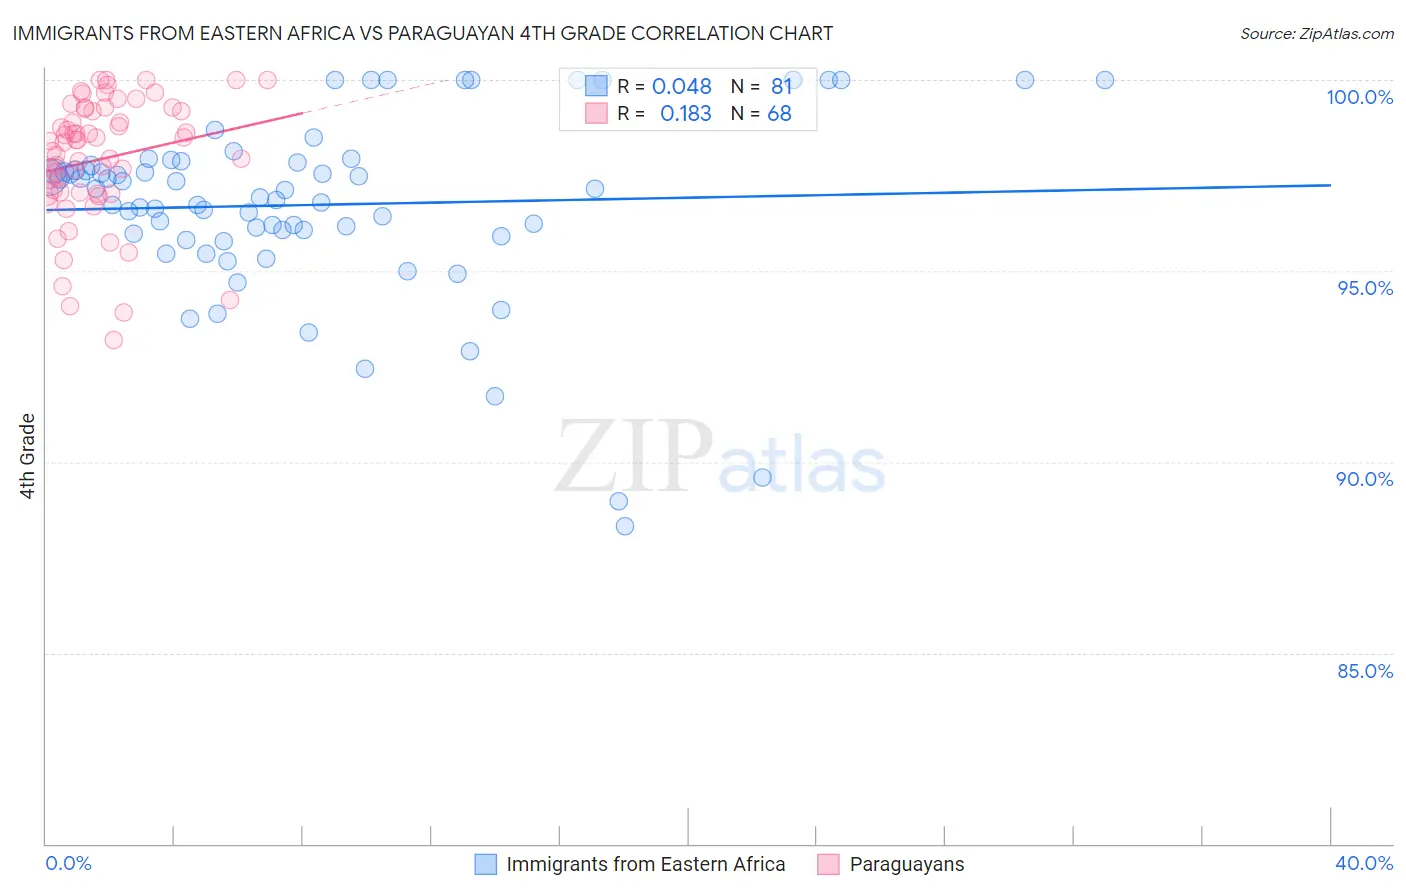
Immigrants from Eastern Africa vs Paraguayan 4th Grade Correlation Chart

The statistical analysis conducted on geographies consisting of 355,144,184 people shows no correlation between the proportion of Immigrants from Eastern Africa and percentage of population with at least 4th grade education in the United States with a correlation coefficient (R) of 0.048 and weighted average of 97.1%. Similarly, the statistical analysis conducted on geographies consisting of 95,115,093 people shows a poor positive correlation between the proportion of Paraguayans and percentage of population with at least 4th grade education in the United States with a correlation coefficient (R) of 0.183 and weighted average of 97.4%, a difference of 0.33%.
Immigrants from Eastern Africa vs Paraguayan 4th Grade

4th Grade Correlation Summary

MeasurementImmigrants from Eastern AfricaParaguayan
Minimum88.3%93.2%
Maximum100.0%100.0%
Range11.7%6.8%
Mean96.7%97.9%
Median97.1%98.4%
Interquartile 25% (IQ1)95.9%97.0%
Interquartile 75% (IQ3)97.8%99.2%
Interquartile Range (IQR)1.9%2.2%
Standard Deviation (Sample)2.4%1.6%
Standard Deviation (Population)2.4%1.6%

Similar Demographics by 4th Grade

Demographics Similar to Immigrants from Eastern Africa by 4th Grade

In terms of 4th grade, the demographic groups most similar to Immigrants from Eastern Africa are Korean (97.1%, a difference of 0.0%), Immigrants from Uruguay (97.1%, a difference of 0.0%), Ethiopian (97.1%, a difference of 0.0%), Asian (97.1%, a difference of 0.010%), and U.S. Virgin Islander (97.1%, a difference of 0.010%).
DemographicsRating | Rank4th Grade
Indians (Asian)
1.9
/100
|
#238
Tragic
97.2%
Nigerians
1.8
/100
|
#239
Tragic
97.1%
Colombians
1.6
/100
|
#240
Tragic
97.1%
Immigrants | Indonesia
1.5
/100
|
#241
Tragic
97.1%
Asians
1.4
/100
|
#242
Tragic
97.1%
U.S. Virgin Islanders
1.4
/100
|
#243
Tragic
97.1%
Koreans
1.3
/100
|
#244
Tragic
97.1%
Immigrants | Eastern Africa
1.2
/100
|
#245
Tragic
97.1%
Immigrants | Uruguay
1.2
/100
|
#246
Tragic
97.1%
Ethiopians
1.2
/100
|
#247
Tragic
97.1%
Immigrants | Asia
1.2
/100
|
#248
Tragic
97.1%
Immigrants | Africa
1.0
/100
|
#249
Tragic
97.1%
Immigrants | Senegal
0.9
/100
|
#250
Tragic
97.1%
South Americans
0.8
/100
|
#251
Tragic
97.1%
Jamaicans
0.8
/100
|
#252
Tragic
97.1%

Demographics Similar to Paraguayans by 4th Grade

In terms of 4th grade, the demographic groups most similar to Paraguayans are Portuguese (97.4%, a difference of 0.0%), Panamanian (97.4%, a difference of 0.010%), Black/African American (97.4%, a difference of 0.010%), Navajo (97.4%, a difference of 0.010%), and Immigrants from Ukraine (97.4%, a difference of 0.010%).
DemographicsRating | Rank4th Grade
Immigrants | Argentina
34.6
/100
|
#188
Fair
97.5%
Panamanians
31.9
/100
|
#189
Fair
97.4%
Blacks/African Americans
31.1
/100
|
#190
Fair
97.4%
Navajo
30.7
/100
|
#191
Fair
97.4%
Immigrants | Ukraine
30.1
/100
|
#192
Fair
97.4%
Immigrants | Egypt
30.1
/100
|
#193
Fair
97.4%
Portuguese
29.2
/100
|
#194
Fair
97.4%
Paraguayans
28.9
/100
|
#195
Fair
97.4%
Immigrants | Albania
27.7
/100
|
#196
Fair
97.4%
Hawaiians
25.6
/100
|
#197
Fair
97.4%
Guamanians/Chamorros
23.0
/100
|
#198
Fair
97.4%
Natives/Alaskans
20.6
/100
|
#199
Fair
97.4%
Immigrants | Uganda
19.8
/100
|
#200
Poor
97.4%
Immigrants | Southern Europe
16.2
/100
|
#201
Poor
97.4%
Immigrants | Chile
16.1
/100
|
#202
Poor
97.4%