Immigrants from Eastern Africa vs Colville 1st Grade
COMPARE
Immigrants from Eastern Africa
Colville
1st Grade
1st Grade Comparison
Immigrants from Eastern Africa
Colville
97.6%
1ST GRADE
1.0/ 100
METRIC RATING
246th/ 347
METRIC RANK
98.2%
1ST GRADE
98.0/ 100
METRIC RATING
100th/ 347
METRIC RANK
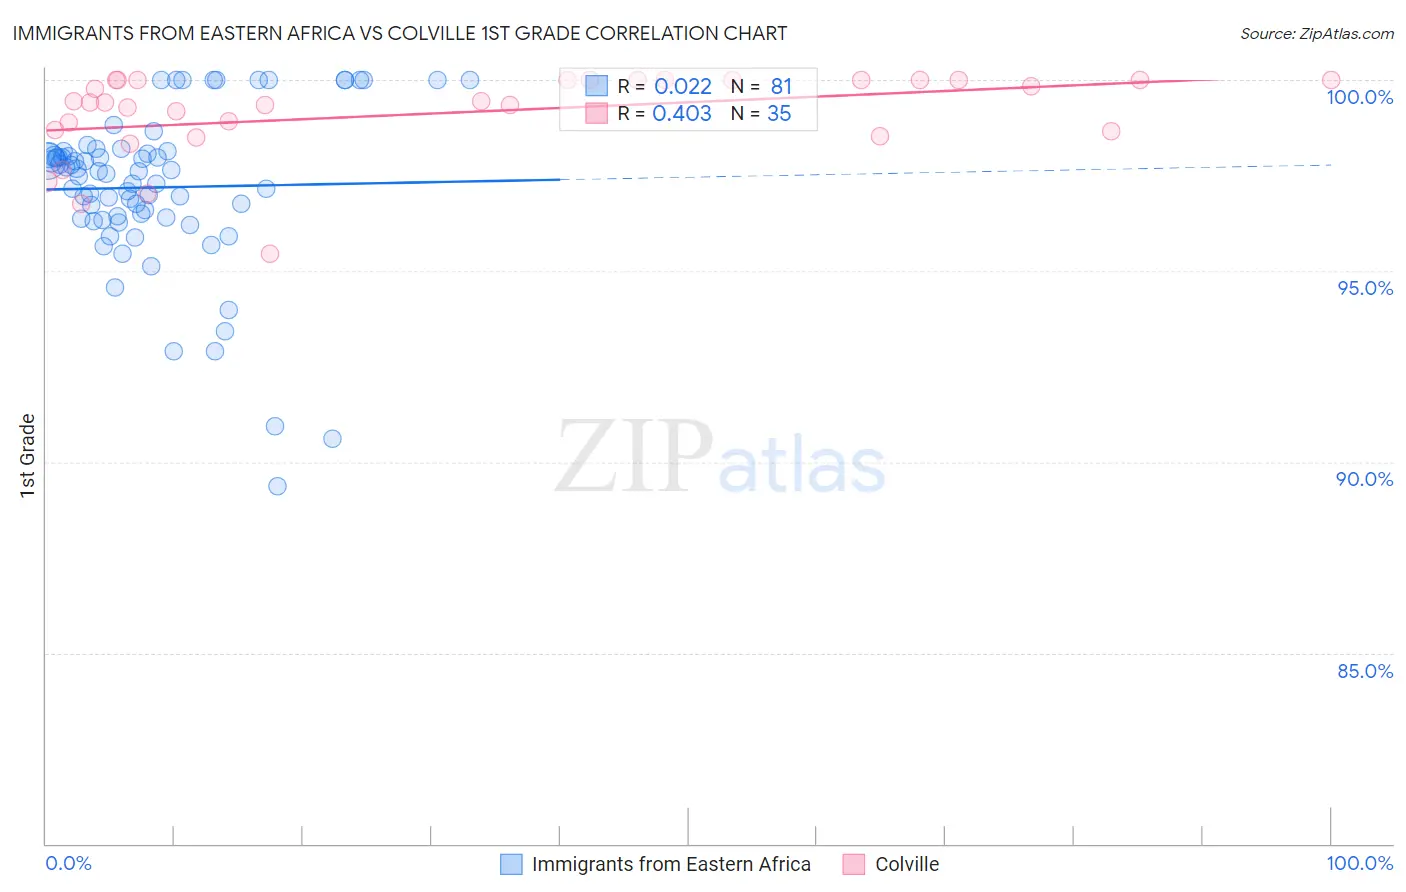
Immigrants from Eastern Africa vs Colville 1st Grade Correlation Chart
The statistical analysis conducted on geographies consisting of 355,144,184 people shows no correlation between the proportion of Immigrants from Eastern Africa and percentage of population with at least 1st grade education in the United States with a correlation coefficient (R) of 0.022 and weighted average of 97.6%. Similarly, the statistical analysis conducted on geographies consisting of 34,687,839 people shows a moderate positive correlation between the proportion of Colville and percentage of population with at least 1st grade education in the United States with a correlation coefficient (R) of 0.403 and weighted average of 98.2%, a difference of 0.66%.
1st Grade Correlation Summary
| Measurement | Immigrants from Eastern Africa | Colville |
| Minimum | 89.4% | 95.4% |
| Maximum | 100.0% | 100.0% |
| Range | 10.6% | 4.6% |
| Mean | 97.2% | 99.1% |
| Median | 97.6% | 99.4% |
| Interquartile 25% (IQ1) | 96.4% | 98.6% |
| Interquartile 75% (IQ3) | 98.1% | 100.0% |
| Interquartile Range (IQR) | 1.7% | 1.4% |
| Standard Deviation (Sample) | 2.1% | 1.1% |
| Standard Deviation (Population) | 2.1% | 1.1% |
Similar Demographics by 1st Grade
Demographics Similar to Immigrants from Eastern Africa by 1st Grade
In terms of 1st grade, the demographic groups most similar to Immigrants from Eastern Africa are Asian (97.6%, a difference of 0.0%), South American (97.6%, a difference of 0.0%), Peruvian (97.6%, a difference of 0.0%), Immigrants from Middle Africa (97.6%, a difference of 0.0%), and Immigrants from Senegal (97.6%, a difference of 0.0%).
| Demographics | Rating | Rank | 1st Grade |
| Immigrants | Eastern Asia | 1.6 /100 | #239 | Tragic 97.6% |
| Koreans | 1.5 /100 | #240 | Tragic 97.6% |
| Liberians | 1.4 /100 | #241 | Tragic 97.6% |
| Immigrants | Indonesia | 1.2 /100 | #242 | Tragic 97.6% |
| Bolivians | 1.2 /100 | #243 | Tragic 97.6% |
| Asians | 1.1 /100 | #244 | Tragic 97.6% |
| South Americans | 1.1 /100 | #245 | Tragic 97.6% |
| Immigrants | Eastern Africa | 1.0 /100 | #246 | Tragic 97.6% |
| Peruvians | 1.0 /100 | #247 | Tragic 97.6% |
| Immigrants | Middle Africa | 1.0 /100 | #248 | Tragic 97.6% |
| Immigrants | Senegal | 1.0 /100 | #249 | Tragic 97.6% |
| Ethiopians | 0.9 /100 | #250 | Tragic 97.6% |
| Immigrants | Iraq | 0.9 /100 | #251 | Tragic 97.6% |
| Immigrants | Africa | 0.9 /100 | #252 | Tragic 97.6% |
| Immigrants | Congo | 0.7 /100 | #253 | Tragic 97.5% |
Demographics Similar to Colville by 1st Grade
In terms of 1st grade, the demographic groups most similar to Colville are Cypriot (98.2%, a difference of 0.010%), Nonimmigrants (98.2%, a difference of 0.010%), Choctaw (98.2%, a difference of 0.010%), Puget Sound Salish (98.2%, a difference of 0.010%), and Romanian (98.2%, a difference of 0.010%).
| Demographics | Rating | Rank | 1st Grade |
| Immigrants | India | 98.6 /100 | #93 | Exceptional 98.2% |
| South Africans | 98.6 /100 | #94 | Exceptional 98.2% |
| Immigrants | Germany | 98.5 /100 | #95 | Exceptional 98.2% |
| Cypriots | 98.3 /100 | #96 | Exceptional 98.2% |
| Immigrants | Nonimmigrants | 98.3 /100 | #97 | Exceptional 98.2% |
| Choctaw | 98.3 /100 | #98 | Exceptional 98.2% |
| Puget Sound Salish | 98.2 /100 | #99 | Exceptional 98.2% |
| Colville | 98.0 /100 | #100 | Exceptional 98.2% |
| Romanians | 97.8 /100 | #101 | Exceptional 98.2% |
| Cree | 97.8 /100 | #102 | Exceptional 98.2% |
| Immigrants | Ireland | 97.7 /100 | #103 | Exceptional 98.2% |
| Pima | 97.5 /100 | #104 | Exceptional 98.2% |
| Basques | 97.4 /100 | #105 | Exceptional 98.2% |
| Turks | 97.4 /100 | #106 | Exceptional 98.2% |
| Immigrants | Switzerland | 97.3 /100 | #107 | Exceptional 98.2% |