Immigrants from Denmark vs Moroccan No Schooling Completed

COMPARE

Immigrants from Denmark
Race
Ancestry
AfghanAfricanAlaska NativeAlaskan AthabascanAlbanianAleutAlsatianAmericanApacheArabArapahoArgentineanArmenianAssyrian/Chaldean/SyriacAustralianAustrianBahamianBangladeshiBarbadianBasqueBelgianBelizeanBermudanBhutaneseBlackfeetBolivianBrazilianBritishBritish West IndianBulgarianBurmeseCajunCambodianCanadianCape VerdeanCarpatho RusynCelticCentral AmericanCentral American IndianCherokeeCheyenneChickasawChileanChineseChippewaChoctawColombianColvilleComancheCosta RicanCreeCreekCroatianCrowCubanCypriotCzechCzechoslovakianDanishDelawareDominicanDutchDutch West IndianEastern EuropeanEcuadorianEgyptianEnglishEstonianEthiopianEuropeanFijianFilipinoFinnishFrenchFrench American IndianFrench CanadianGermanGerman RussianGhanaianGreekGuamanian/ChamorroGuatemalanGuyaneseHaitianHmongHonduranHopiHoumaHungarianIcelanderIndian (Asian)IndonesianInupiatIranianIraqiIrishIroquoisIsraeliItalianJamaicanJapaneseJordanianKenyanKiowaKoreanLaotianLatvianLebaneseLiberianLithuanianLumbeeLuxembourgerMacedonianMalaysianMalteseMarshalleseMenomineeMexicanMexican American IndianMongolianNative HawaiianNavajoNepaleseNew ZealanderNicaraguanNigerianNorthern EuropeanNorwegianOkinawanOsageOttawaPaiutePakistaniPalestinianPanamanianParaguayanPennsylvania GermanPeruvianPimaPolishPortuguesePotawatomiPuebloPuerto RicanPuget Sound SalishRomanianRussianSalvadoranSamoanScandinavianScotch-IrishScottishSeminoleSenegaleseSerbianShoshoneSierra LeoneanSiouxSlavicSlovakSloveneSomaliSouth AfricanSouth AmericanSouth American IndianSoviet UnionSpaniardSpanishSpanish AmericanSpanish American IndianSri LankanSubsaharan AfricanSudaneseSwedishSwissSyrianTaiwaneseThaiTlingit-HaidaTohono O'OdhamTonganTrinidadian and TobagonianTsimshianTurkishU.S. Virgin IslanderUgandanUkrainianUruguayanUteVenezuelanVietnameseWelshWest IndianYakamaYaquiYugoslavianYumanYup'ikZimbabwean
Immigration
NonimmigrantsImmigrantsAfghanistanAfricaAlbaniaArgentinaArmeniaAsiaAustraliaAustriaBahamasBangladeshBarbadosBelarusBelgiumBelizeBoliviaBosnia and HerzegovinaBrazilBulgariaBurma/MyanmarCabo VerdeCambodiaCameroonCanadaCaribbeanCentral AmericaChileChinaColombiaCongoCosta RicaCroatiaCubaCzechoslovakiaDenmarkDominicaDominican RepublicEastern AfricaEastern AsiaEastern EuropeEcuadorEgyptEl SalvadorEnglandEritreaEthiopiaEuropeFijiFranceGermanyGhanaGreeceGrenadaGuatemalaGuyanaHaitiHondurasHong KongHungaryIndiaIndonesiaIranIraqIrelandIsraelItalyJamaicaJapanJordanKazakhstanKenyaKoreaKuwaitLaosLatin AmericaLatviaLebanonLiberiaLithuaniaMalaysiaMexicoMicronesiaMiddle AfricaMoldovaMoroccoNepalNetherlandsNicaraguaNigeriaNorth AmericaNorth MacedoniaNorthern AfricaNorthern EuropeNorwayOceaniaPakistanPanamaPeruPhilippinesPolandPortugalRomaniaRussiaSaudi ArabiaScotlandSenegalSerbiaSierra LeoneSingaporeSomaliaSouth AfricaSouth AmericaSouth Central AsiaSouth Eastern AsiaSouthern EuropeSpainSri LankaSt. Vincent and the GrenadinesSudanSwedenSwitzerlandSyriaTaiwanThailandTrinidad and TobagoTurkeyUgandaUkraineUruguayUzbekistanVenezuelaVietnamWest IndiesWestern AfricaWestern AsiaWestern EuropeYemenZaireZimbabweAzores
Moroccan
Race
Ancestry
AfghanAfricanAlaska NativeAlaskan AthabascanAlbanianAleutAlsatianAmericanApacheArabArapahoArgentineanArmenianAssyrian/Chaldean/SyriacAustralianAustrianBahamianBangladeshiBarbadianBasqueBelgianBelizeanBermudanBhutaneseBlackfeetBolivianBrazilianBritishBritish West IndianBulgarianBurmeseCajunCambodianCanadianCape VerdeanCarpatho RusynCelticCentral AmericanCentral American IndianCherokeeCheyenneChickasawChileanChineseChippewaChoctawColombianColvilleComancheCosta RicanCreeCreekCroatianCrowCubanCypriotCzechCzechoslovakianDanishDelawareDominicanDutchDutch West IndianEastern EuropeanEcuadorianEgyptianEnglishEstonianEthiopianEuropeanFijianFilipinoFinnishFrenchFrench American IndianFrench CanadianGermanGerman RussianGhanaianGreekGuamanian/ChamorroGuatemalanGuyaneseHaitianHmongHonduranHopiHoumaHungarianIcelanderIndian (Asian)IndonesianInupiatIranianIraqiIrishIroquoisIsraeliItalianJamaicanJapaneseJordanianKenyanKiowaKoreanLaotianLatvianLebaneseLiberianLithuanianLumbeeLuxembourgerMacedonianMalaysianMalteseMarshalleseMenomineeMexicanMexican American IndianMongolianMoroccanNative HawaiianNavajoNepaleseNew ZealanderNicaraguanNigerianNorthern EuropeanNorwegianOkinawanOsageOttawaPaiutePakistaniPalestinianPanamanianParaguayanPennsylvania GermanPeruvianPimaPolishPortuguesePotawatomiPuebloPuerto RicanPuget Sound SalishRomanianRussianSalvadoranSamoanScandinavianScotch-IrishScottishSeminoleSenegaleseSerbianShoshoneSierra LeoneanSiouxSlavicSlovakSloveneSomaliSouth AfricanSouth AmericanSouth American IndianSoviet UnionSpaniardSpanishSpanish AmericanSpanish American IndianSri LankanSubsaharan AfricanSudaneseSwedishSwissSyrianTaiwaneseThaiTlingit-HaidaTohono O'OdhamTonganTrinidadian and TobagonianTsimshianTurkishU.S. Virgin IslanderUgandanUkrainianUruguayanUteVenezuelanVietnameseWelshWest IndianYakamaYaquiYugoslavianYumanYup'ikZimbabwean
Immigration
NonimmigrantsImmigrantsAfghanistanAfricaAlbaniaArgentinaArmeniaAsiaAustraliaAustriaBahamasBangladeshBarbadosBelarusBelgiumBelizeBoliviaBosnia and HerzegovinaBrazilBulgariaBurma/MyanmarCabo VerdeCambodiaCameroonCanadaCaribbeanCentral AmericaChileChinaColombiaCongoCosta RicaCroatiaCubaCzechoslovakiaDominicaDominican RepublicEastern AfricaEastern AsiaEastern EuropeEcuadorEgyptEl SalvadorEnglandEritreaEthiopiaEuropeFijiFranceGermanyGhanaGreeceGrenadaGuatemalaGuyanaHaitiHondurasHong KongHungaryIndiaIndonesiaIranIraqIrelandIsraelItalyJamaicaJapanJordanKazakhstanKenyaKoreaKuwaitLaosLatin AmericaLatviaLebanonLiberiaLithuaniaMalaysiaMexicoMicronesiaMiddle AfricaMoldovaMoroccoNepalNetherlandsNicaraguaNigeriaNorth AmericaNorth MacedoniaNorthern AfricaNorthern EuropeNorwayOceaniaPakistanPanamaPeruPhilippinesPolandPortugalRomaniaRussiaSaudi ArabiaScotlandSenegalSerbiaSierra LeoneSingaporeSomaliaSouth AfricaSouth AmericaSouth Central AsiaSouth Eastern AsiaSouthern EuropeSpainSri LankaSt. Vincent and the GrenadinesSudanSwedenSwitzerlandSyriaTaiwanThailandTrinidad and TobagoTurkeyUgandaUkraineUruguayUzbekistanVenezuelaVietnamWest IndiesWestern AfricaWestern AsiaWestern EuropeYemenZaireZimbabweAzores
No Schooling Completed
Income
Poverty
Unemployment
Labor Participation
Family Structure
Vehicle Availability
Education Level
Disability

No Schooling Completed Comparison

Immigrants from Denmark

Moroccans

Exceptional
Poor
1.7%
NO SCHOOLING COMPLETED
99.2/ 100
METRIC RATING
84th/ 347
METRIC RANK
2.2%
NO SCHOOLING COMPLETED
13.7/ 100
METRIC RATING
202nd/ 347
METRIC RANK

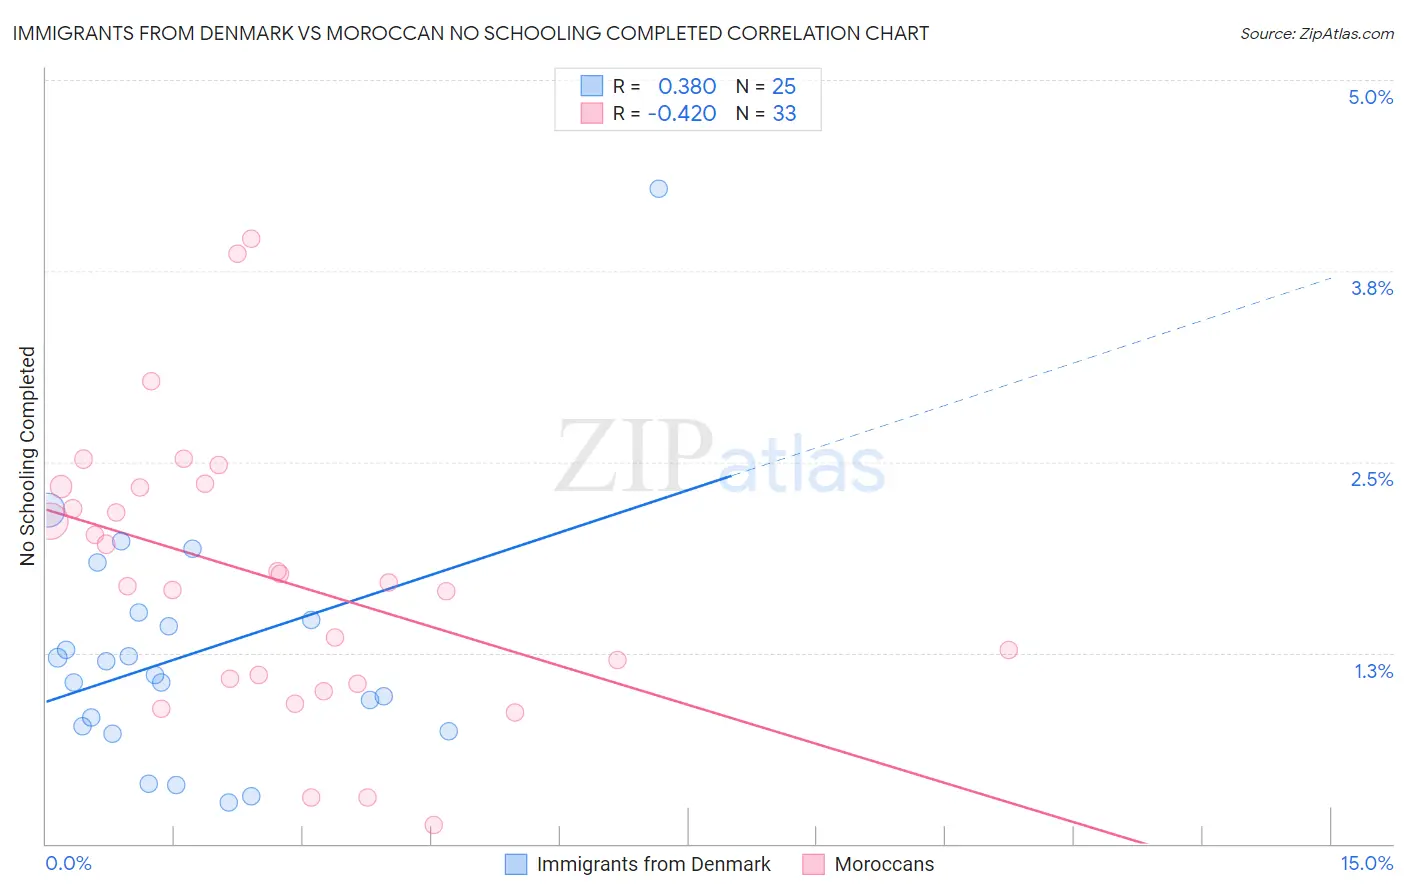
Immigrants from Denmark vs Moroccan No Schooling Completed Correlation Chart

The statistical analysis conducted on geographies consisting of 135,590,094 people shows a mild positive correlation between the proportion of Immigrants from Denmark and percentage of population with no schooling in the United States with a correlation coefficient (R) of 0.380 and weighted average of 1.7%. Similarly, the statistical analysis conducted on geographies consisting of 201,160,472 people shows a moderate negative correlation between the proportion of Moroccans and percentage of population with no schooling in the United States with a correlation coefficient (R) of -0.420 and weighted average of 2.2%, a difference of 27.0%.
Immigrants from Denmark vs Moroccan No Schooling Completed

No Schooling Completed Correlation Summary

MeasurementImmigrants from DenmarkMoroccan
Minimum0.27%0.12%
Maximum4.3%4.0%
Range4.0%3.8%
Mean1.2%1.7%
Median1.1%1.7%
Interquartile 25% (IQ1)0.75%1.1%
Interquartile 75% (IQ3)1.5%2.3%
Interquartile Range (IQR)0.74%1.3%
Standard Deviation (Sample)0.82%0.90%
Standard Deviation (Population)0.80%0.89%

Similar Demographics by No Schooling Completed

Demographics Similar to Immigrants from Denmark by No Schooling Completed

In terms of no schooling completed, the demographic groups most similar to Immigrants from Denmark are Immigrants from Australia (1.7%, a difference of 0.040%), Potawatomi (1.7%, a difference of 0.050%), Ukrainian (1.8%, a difference of 0.090%), Immigrants from South Africa (1.7%, a difference of 0.16%), and Icelander (1.7%, a difference of 0.25%).
DemographicsRating | RankNo Schooling Completed
Immigrants | Sweden
99.3
/100
|
#77
Exceptional
1.7%
Delaware
99.3
/100
|
#78
Exceptional
1.7%
Macedonians
99.3
/100
|
#79
Exceptional
1.7%
Cypriots
99.3
/100
|
#80
Exceptional
1.7%
Icelanders
99.3
/100
|
#81
Exceptional
1.7%
Immigrants | South Africa
99.3
/100
|
#82
Exceptional
1.7%
Potawatomi
99.3
/100
|
#83
Exceptional
1.7%
Immigrants | Denmark
99.2
/100
|
#84
Exceptional
1.7%
Immigrants | Australia
99.2
/100
|
#85
Exceptional
1.7%
Ukrainians
99.2
/100
|
#86
Exceptional
1.8%
Osage
99.2
/100
|
#87
Exceptional
1.8%
Immigrants | Western Europe
99.2
/100
|
#88
Exceptional
1.8%
South Africans
99.1
/100
|
#89
Exceptional
1.8%
Sioux
99.0
/100
|
#90
Exceptional
1.8%
Immigrants | Germany
99.0
/100
|
#91
Exceptional
1.8%

Demographics Similar to Moroccans by No Schooling Completed

In terms of no schooling completed, the demographic groups most similar to Moroccans are Laotian (2.2%, a difference of 0.11%), Hopi (2.2%, a difference of 0.22%), Immigrants from Bahamas (2.2%, a difference of 0.62%), Bahamian (2.2%, a difference of 0.63%), and South American Indian (2.2%, a difference of 0.81%).
DemographicsRating | RankNo Schooling Completed
Hawaiians
27.0
/100
|
#195
Fair
2.2%
Immigrants | Ukraine
26.1
/100
|
#196
Fair
2.2%
Immigrants | Southern Europe
23.8
/100
|
#197
Fair
2.2%
Immigrants | Chile
22.7
/100
|
#198
Fair
2.2%
Africans
21.8
/100
|
#199
Fair
2.2%
Immigrants | Northern Africa
19.5
/100
|
#200
Poor
2.2%
Costa Ricans
17.1
/100
|
#201
Poor
2.2%
Moroccans
13.7
/100
|
#202
Poor
2.2%
Laotians
13.3
/100
|
#203
Poor
2.2%
Hopi
12.9
/100
|
#204
Poor
2.2%
Immigrants | Bahamas
11.6
/100
|
#205
Poor
2.2%
Bahamians
11.6
/100
|
#206
Poor
2.2%
South American Indians
11.0
/100
|
#207
Poor
2.2%
Uruguayans
11.0
/100
|
#208
Poor
2.2%
Immigrants | Oceania
10.2
/100
|
#209
Poor
2.2%