Immigrants from Czechoslovakia vs Cypriot Bachelor's Degree

COMPARE

Immigrants from Czechoslovakia
Race
Ancestry
AfghanAfricanAlaska NativeAlaskan AthabascanAlbanianAleutAlsatianAmericanApacheArabArapahoArgentineanArmenianAssyrian/Chaldean/SyriacAustralianAustrianBahamianBangladeshiBarbadianBasqueBelgianBelizeanBermudanBhutaneseBlackfeetBolivianBrazilianBritishBritish West IndianBulgarianBurmeseCajunCambodianCanadianCape VerdeanCarpatho RusynCelticCentral AmericanCentral American IndianCherokeeCheyenneChickasawChileanChineseChippewaChoctawColombianColvilleComancheCosta RicanCreeCreekCroatianCrowCubanCzechCzechoslovakianDanishDelawareDominicanDutchDutch West IndianEastern EuropeanEcuadorianEgyptianEnglishEstonianEthiopianEuropeanFijianFilipinoFinnishFrenchFrench American IndianFrench CanadianGermanGerman RussianGhanaianGreekGuamanian/ChamorroGuatemalanGuyaneseHaitianHmongHonduranHopiHoumaHungarianIcelanderIndian (Asian)IndonesianInupiatIranianIraqiIrishIroquoisIsraeliItalianJamaicanJapaneseJordanianKenyanKiowaKoreanLaotianLatvianLebaneseLiberianLithuanianLumbeeLuxembourgerMacedonianMalaysianMalteseMarshalleseMenomineeMexicanMexican American IndianMongolianMoroccanNative HawaiianNavajoNepaleseNew ZealanderNicaraguanNigerianNorthern EuropeanNorwegianOkinawanOsageOttawaPaiutePakistaniPalestinianPanamanianParaguayanPennsylvania GermanPeruvianPimaPolishPortuguesePotawatomiPuebloPuerto RicanPuget Sound SalishRomanianRussianSalvadoranSamoanScandinavianScotch-IrishScottishSeminoleSenegaleseSerbianShoshoneSierra LeoneanSiouxSlavicSlovakSloveneSomaliSouth AfricanSouth AmericanSouth American IndianSoviet UnionSpaniardSpanishSpanish AmericanSpanish American IndianSri LankanSubsaharan AfricanSudaneseSwedishSwissSyrianTaiwaneseThaiTlingit-HaidaTohono O'OdhamTonganTrinidadian and TobagonianTsimshianTurkishU.S. Virgin IslanderUgandanUkrainianUruguayanUteVenezuelanVietnameseWelshWest IndianYakamaYaquiYugoslavianYumanYup'ikZimbabwean
Immigration
NonimmigrantsImmigrantsAfghanistanAfricaAlbaniaArgentinaArmeniaAsiaAustraliaAustriaBahamasBangladeshBarbadosBelarusBelgiumBelizeBoliviaBosnia and HerzegovinaBrazilBulgariaBurma/MyanmarCabo VerdeCambodiaCameroonCanadaCaribbeanCentral AmericaChileChinaColombiaCongoCosta RicaCroatiaCubaCzechoslovakiaDenmarkDominicaDominican RepublicEastern AfricaEastern AsiaEastern EuropeEcuadorEgyptEl SalvadorEnglandEritreaEthiopiaEuropeFijiFranceGermanyGhanaGreeceGrenadaGuatemalaGuyanaHaitiHondurasHong KongHungaryIndiaIndonesiaIranIraqIrelandIsraelItalyJamaicaJapanJordanKazakhstanKenyaKoreaKuwaitLaosLatin AmericaLatviaLebanonLiberiaLithuaniaMalaysiaMexicoMicronesiaMiddle AfricaMoldovaMoroccoNepalNetherlandsNicaraguaNigeriaNorth AmericaNorth MacedoniaNorthern AfricaNorthern EuropeNorwayOceaniaPakistanPanamaPeruPhilippinesPolandPortugalRomaniaRussiaSaudi ArabiaScotlandSenegalSerbiaSierra LeoneSingaporeSomaliaSouth AfricaSouth AmericaSouth Central AsiaSouth Eastern AsiaSouthern EuropeSpainSri LankaSt. Vincent and the GrenadinesSudanSwedenSwitzerlandSyriaTaiwanThailandTrinidad and TobagoTurkeyUgandaUkraineUruguayUzbekistanVenezuelaVietnamWest IndiesWestern AfricaWestern AsiaWestern EuropeYemenZaireZimbabweAzores
Cypriot
Race
Ancestry
AfghanAfricanAlaska NativeAlaskan AthabascanAlbanianAleutAlsatianAmericanApacheArabArapahoArgentineanArmenianAssyrian/Chaldean/SyriacAustralianAustrianBahamianBangladeshiBarbadianBasqueBelgianBelizeanBermudanBhutaneseBlackfeetBolivianBrazilianBritishBritish West IndianBulgarianBurmeseCajunCambodianCanadianCape VerdeanCarpatho RusynCelticCentral AmericanCentral American IndianCherokeeCheyenneChickasawChileanChineseChippewaChoctawColombianColvilleComancheCosta RicanCreeCreekCroatianCrowCubanCypriotCzechCzechoslovakianDanishDelawareDominicanDutchDutch West IndianEastern EuropeanEcuadorianEgyptianEnglishEstonianEthiopianEuropeanFijianFilipinoFinnishFrenchFrench American IndianFrench CanadianGermanGerman RussianGhanaianGreekGuamanian/ChamorroGuatemalanGuyaneseHaitianHmongHonduranHopiHoumaHungarianIcelanderIndian (Asian)IndonesianInupiatIranianIraqiIrishIroquoisIsraeliItalianJamaicanJapaneseJordanianKenyanKiowaKoreanLaotianLatvianLebaneseLiberianLithuanianLumbeeLuxembourgerMacedonianMalaysianMalteseMarshalleseMenomineeMexicanMexican American IndianMongolianMoroccanNative HawaiianNavajoNepaleseNew ZealanderNicaraguanNigerianNorthern EuropeanNorwegianOkinawanOsageOttawaPaiutePakistaniPalestinianPanamanianParaguayanPennsylvania GermanPeruvianPimaPolishPortuguesePotawatomiPuebloPuerto RicanPuget Sound SalishRomanianRussianSalvadoranSamoanScandinavianScotch-IrishScottishSeminoleSenegaleseSerbianShoshoneSierra LeoneanSiouxSlavicSlovakSloveneSomaliSouth AfricanSouth AmericanSouth American IndianSoviet UnionSpaniardSpanishSpanish AmericanSpanish American IndianSri LankanSubsaharan AfricanSudaneseSwedishSwissSyrianTaiwaneseThaiTlingit-HaidaTohono O'OdhamTonganTrinidadian and TobagonianTsimshianTurkishU.S. Virgin IslanderUgandanUkrainianUruguayanUteVenezuelanVietnameseWelshWest IndianYakamaYaquiYugoslavianYumanYup'ikZimbabwean
Immigration
NonimmigrantsImmigrantsAfghanistanAfricaAlbaniaArgentinaArmeniaAsiaAustraliaAustriaBahamasBangladeshBarbadosBelarusBelgiumBelizeBoliviaBosnia and HerzegovinaBrazilBulgariaBurma/MyanmarCabo VerdeCambodiaCameroonCanadaCaribbeanCentral AmericaChileChinaColombiaCongoCosta RicaCroatiaCubaDenmarkDominicaDominican RepublicEastern AfricaEastern AsiaEastern EuropeEcuadorEgyptEl SalvadorEnglandEritreaEthiopiaEuropeFijiFranceGermanyGhanaGreeceGrenadaGuatemalaGuyanaHaitiHondurasHong KongHungaryIndiaIndonesiaIranIraqIrelandIsraelItalyJamaicaJapanJordanKazakhstanKenyaKoreaKuwaitLaosLatin AmericaLatviaLebanonLiberiaLithuaniaMalaysiaMexicoMicronesiaMiddle AfricaMoldovaMoroccoNepalNetherlandsNicaraguaNigeriaNorth AmericaNorth MacedoniaNorthern AfricaNorthern EuropeNorwayOceaniaPakistanPanamaPeruPhilippinesPolandPortugalRomaniaRussiaSaudi ArabiaScotlandSenegalSerbiaSierra LeoneSingaporeSomaliaSouth AfricaSouth AmericaSouth Central AsiaSouth Eastern AsiaSouthern EuropeSpainSri LankaSt. Vincent and the GrenadinesSudanSwedenSwitzerlandSyriaTaiwanThailandTrinidad and TobagoTurkeyUgandaUkraineUruguayUzbekistanVenezuelaVietnamWest IndiesWestern AfricaWestern AsiaWestern EuropeYemenZaireZimbabweAzores
Bachelor's Degree
Income
Poverty
Unemployment
Labor Participation
Family Structure
Vehicle Availability
Education Level
Disability

Bachelor's Degree Comparison

Immigrants from Czechoslovakia

Cypriots

Exceptional
Exceptional
44.0%
BACHELOR'S DEGREE
99.9/ 100
METRIC RATING
58th/ 347
METRIC RANK
49.0%
BACHELOR'S DEGREE
100.0/ 100
METRIC RATING
10th/ 347
METRIC RANK

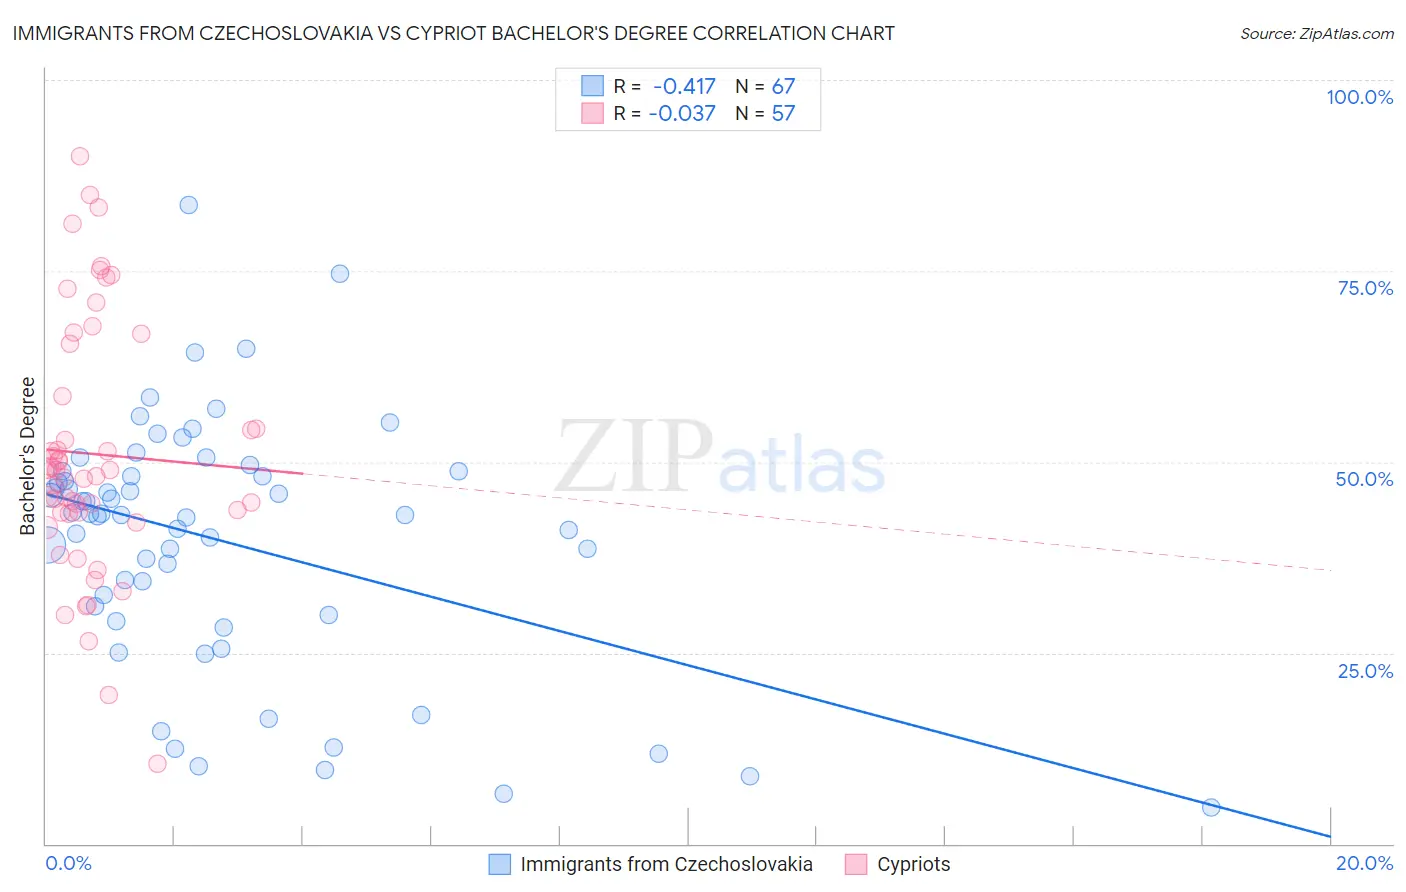
Immigrants from Czechoslovakia vs Cypriot Bachelor's Degree Correlation Chart

The statistical analysis conducted on geographies consisting of 195,448,477 people shows a moderate negative correlation between the proportion of Immigrants from Czechoslovakia and percentage of population with at least bachelor's degree education in the United States with a correlation coefficient (R) of -0.417 and weighted average of 44.0%. Similarly, the statistical analysis conducted on geographies consisting of 61,864,138 people shows no correlation between the proportion of Cypriots and percentage of population with at least bachelor's degree education in the United States with a correlation coefficient (R) of -0.037 and weighted average of 49.0%, a difference of 11.4%.
Immigrants from Czechoslovakia vs Cypriot Bachelor's Degree

Bachelor's Degree Correlation Summary

MeasurementImmigrants from CzechoslovakiaCypriot
Minimum4.8%10.5%
Maximum83.6%90.0%
Range78.9%79.5%
Mean39.6%51.0%
Median43.1%48.9%
Interquartile 25% (IQ1)29.9%43.3%
Interquartile 75% (IQ3)48.7%62.0%
Interquartile Range (IQR)18.8%18.7%
Standard Deviation (Sample)16.3%16.5%
Standard Deviation (Population)16.2%16.3%

Similar Demographics by Bachelor's Degree

Demographics Similar to Immigrants from Czechoslovakia by Bachelor's Degree

In terms of bachelor's degree, the demographic groups most similar to Immigrants from Czechoslovakia are Paraguayan (44.0%, a difference of 0.050%), Australian (44.0%, a difference of 0.10%), New Zealander (44.0%, a difference of 0.11%), Immigrants from Serbia (44.1%, a difference of 0.24%), and Immigrants from Bolivia (44.2%, a difference of 0.42%).
DemographicsRating | RankBachelor's Degree
Asians
99.9
/100
|
#51
Exceptional
44.4%
Immigrants | Spain
99.9
/100
|
#52
Exceptional
44.3%
Immigrants | Asia
99.9
/100
|
#53
Exceptional
44.3%
Immigrants | Austria
99.9
/100
|
#54
Exceptional
44.2%
Immigrants | Bolivia
99.9
/100
|
#55
Exceptional
44.2%
Immigrants | Serbia
99.9
/100
|
#56
Exceptional
44.1%
Paraguayans
99.9
/100
|
#57
Exceptional
44.0%
Immigrants | Czechoslovakia
99.9
/100
|
#58
Exceptional
44.0%
Australians
99.9
/100
|
#59
Exceptional
44.0%
New Zealanders
99.9
/100
|
#60
Exceptional
44.0%
South Africans
99.8
/100
|
#61
Exceptional
43.6%
Immigrants | Kazakhstan
99.8
/100
|
#62
Exceptional
43.4%
Immigrants | Europe
99.8
/100
|
#63
Exceptional
43.4%
Argentineans
99.7
/100
|
#64
Exceptional
43.3%
Zimbabweans
99.7
/100
|
#65
Exceptional
43.3%

Demographics Similar to Cypriots by Bachelor's Degree

In terms of bachelor's degree, the demographic groups most similar to Cypriots are Immigrants from Australia (48.5%, a difference of 1.1%), Immigrants from China (48.4%, a difference of 1.3%), Immigrants from South Central Asia (48.3%, a difference of 1.5%), Immigrants from Hong Kong (48.2%, a difference of 1.7%), and Immigrants from Eastern Asia (48.1%, a difference of 1.9%).
DemographicsRating | RankBachelor's Degree
Immigrants | India
100.0
/100
|
#3
Exceptional
51.3%
Immigrants | Taiwan
100.0
/100
|
#4
Exceptional
51.2%
Iranians
100.0
/100
|
#5
Exceptional
51.0%
Okinawans
100.0
/100
|
#6
Exceptional
50.5%
Immigrants | Iran
100.0
/100
|
#7
Exceptional
50.3%
Thais
100.0
/100
|
#8
Exceptional
50.1%
Immigrants | Israel
100.0
/100
|
#9
Exceptional
50.0%
Cypriots
100.0
/100
|
#10
Exceptional
49.0%
Immigrants | Australia
100.0
/100
|
#11
Exceptional
48.5%
Immigrants | China
100.0
/100
|
#12
Exceptional
48.4%
Immigrants | South Central Asia
100.0
/100
|
#13
Exceptional
48.3%
Immigrants | Hong Kong
100.0
/100
|
#14
Exceptional
48.2%
Immigrants | Eastern Asia
100.0
/100
|
#15
Exceptional
48.1%
Soviet Union
100.0
/100
|
#16
Exceptional
47.9%
Eastern Europeans
100.0
/100
|
#17
Exceptional
47.5%