Immigrants from Czechoslovakia vs Bahamian 6th Grade

COMPARE

Immigrants from Czechoslovakia
Race
Ancestry
AfghanAfricanAlaska NativeAlaskan AthabascanAlbanianAleutAlsatianAmericanApacheArabArapahoArgentineanArmenianAssyrian/Chaldean/SyriacAustralianAustrianBangladeshiBarbadianBasqueBelgianBelizeanBermudanBhutaneseBlackfeetBolivianBrazilianBritishBritish West IndianBulgarianBurmeseCajunCambodianCanadianCape VerdeanCarpatho RusynCelticCentral AmericanCentral American IndianCherokeeCheyenneChickasawChileanChineseChippewaChoctawColombianColvilleComancheCosta RicanCreeCreekCroatianCrowCubanCypriotCzechCzechoslovakianDanishDelawareDominicanDutchDutch West IndianEastern EuropeanEcuadorianEgyptianEnglishEstonianEthiopianEuropeanFijianFilipinoFinnishFrenchFrench American IndianFrench CanadianGermanGerman RussianGhanaianGreekGuamanian/ChamorroGuatemalanGuyaneseHaitianHmongHonduranHopiHoumaHungarianIcelanderIndian (Asian)IndonesianInupiatIranianIraqiIrishIroquoisIsraeliItalianJamaicanJapaneseJordanianKenyanKiowaKoreanLaotianLatvianLebaneseLiberianLithuanianLumbeeLuxembourgerMacedonianMalaysianMalteseMarshalleseMenomineeMexicanMexican American IndianMongolianMoroccanNative HawaiianNavajoNepaleseNew ZealanderNicaraguanNigerianNorthern EuropeanNorwegianOkinawanOsageOttawaPaiutePakistaniPalestinianPanamanianParaguayanPennsylvania GermanPeruvianPimaPolishPortuguesePotawatomiPuebloPuerto RicanPuget Sound SalishRomanianRussianSalvadoranSamoanScandinavianScotch-IrishScottishSeminoleSenegaleseSerbianShoshoneSierra LeoneanSiouxSlavicSlovakSloveneSomaliSouth AfricanSouth AmericanSouth American IndianSoviet UnionSpaniardSpanishSpanish AmericanSpanish American IndianSri LankanSubsaharan AfricanSudaneseSwedishSwissSyrianTaiwaneseThaiTlingit-HaidaTohono O'OdhamTonganTrinidadian and TobagonianTsimshianTurkishU.S. Virgin IslanderUgandanUkrainianUruguayanUteVenezuelanVietnameseWelshWest IndianYakamaYaquiYugoslavianYumanYup'ikZimbabwean
Immigration
NonimmigrantsImmigrantsAfghanistanAfricaAlbaniaArgentinaArmeniaAsiaAustraliaAustriaBahamasBangladeshBarbadosBelarusBelgiumBelizeBoliviaBosnia and HerzegovinaBrazilBulgariaBurma/MyanmarCabo VerdeCambodiaCameroonCanadaCaribbeanCentral AmericaChileChinaColombiaCongoCosta RicaCroatiaCubaCzechoslovakiaDenmarkDominicaDominican RepublicEastern AfricaEastern AsiaEastern EuropeEcuadorEgyptEl SalvadorEnglandEritreaEthiopiaEuropeFijiFranceGermanyGhanaGreeceGrenadaGuatemalaGuyanaHaitiHondurasHong KongHungaryIndiaIndonesiaIranIraqIrelandIsraelItalyJamaicaJapanJordanKazakhstanKenyaKoreaKuwaitLaosLatin AmericaLatviaLebanonLiberiaLithuaniaMalaysiaMexicoMicronesiaMiddle AfricaMoldovaMoroccoNepalNetherlandsNicaraguaNigeriaNorth AmericaNorth MacedoniaNorthern AfricaNorthern EuropeNorwayOceaniaPakistanPanamaPeruPhilippinesPolandPortugalRomaniaRussiaSaudi ArabiaScotlandSenegalSerbiaSierra LeoneSingaporeSomaliaSouth AfricaSouth AmericaSouth Central AsiaSouth Eastern AsiaSouthern EuropeSpainSri LankaSt. Vincent and the GrenadinesSudanSwedenSwitzerlandSyriaTaiwanThailandTrinidad and TobagoTurkeyUgandaUkraineUruguayUzbekistanVenezuelaVietnamWest IndiesWestern AfricaWestern AsiaWestern EuropeYemenZaireZimbabweAzores
Bahamian
Race
Ancestry
AfghanAfricanAlaska NativeAlaskan AthabascanAlbanianAleutAlsatianAmericanApacheArabArapahoArgentineanArmenianAssyrian/Chaldean/SyriacAustralianAustrianBahamianBangladeshiBarbadianBasqueBelgianBelizeanBermudanBhutaneseBlackfeetBolivianBrazilianBritishBritish West IndianBulgarianBurmeseCajunCambodianCanadianCape VerdeanCarpatho RusynCelticCentral AmericanCentral American IndianCherokeeCheyenneChickasawChileanChineseChippewaChoctawColombianColvilleComancheCosta RicanCreeCreekCroatianCrowCubanCypriotCzechCzechoslovakianDanishDelawareDominicanDutchDutch West IndianEastern EuropeanEcuadorianEgyptianEnglishEstonianEthiopianEuropeanFijianFilipinoFinnishFrenchFrench American IndianFrench CanadianGermanGerman RussianGhanaianGreekGuamanian/ChamorroGuatemalanGuyaneseHaitianHmongHonduranHopiHoumaHungarianIcelanderIndian (Asian)IndonesianInupiatIranianIraqiIrishIroquoisIsraeliItalianJamaicanJapaneseJordanianKenyanKiowaKoreanLaotianLatvianLebaneseLiberianLithuanianLumbeeLuxembourgerMacedonianMalaysianMalteseMarshalleseMenomineeMexicanMexican American IndianMongolianMoroccanNative HawaiianNavajoNepaleseNew ZealanderNicaraguanNigerianNorthern EuropeanNorwegianOkinawanOsageOttawaPaiutePakistaniPalestinianPanamanianParaguayanPennsylvania GermanPeruvianPimaPolishPortuguesePotawatomiPuebloPuerto RicanPuget Sound SalishRomanianRussianSalvadoranSamoanScandinavianScotch-IrishScottishSeminoleSenegaleseSerbianShoshoneSierra LeoneanSiouxSlavicSlovakSloveneSomaliSouth AfricanSouth AmericanSouth American IndianSoviet UnionSpaniardSpanishSpanish AmericanSpanish American IndianSri LankanSubsaharan AfricanSudaneseSwedishSwissSyrianTaiwaneseThaiTlingit-HaidaTohono O'OdhamTonganTrinidadian and TobagonianTsimshianTurkishU.S. Virgin IslanderUgandanUkrainianUruguayanUteVenezuelanVietnameseWelshWest IndianYakamaYaquiYugoslavianYumanYup'ikZimbabwean
Immigration
NonimmigrantsImmigrantsAfghanistanAfricaAlbaniaArgentinaArmeniaAsiaAustraliaAustriaBahamasBangladeshBarbadosBelarusBelgiumBelizeBoliviaBosnia and HerzegovinaBrazilBulgariaBurma/MyanmarCabo VerdeCambodiaCameroonCanadaCaribbeanCentral AmericaChileChinaColombiaCongoCosta RicaCroatiaCubaDenmarkDominicaDominican RepublicEastern AfricaEastern AsiaEastern EuropeEcuadorEgyptEl SalvadorEnglandEritreaEthiopiaEuropeFijiFranceGermanyGhanaGreeceGrenadaGuatemalaGuyanaHaitiHondurasHong KongHungaryIndiaIndonesiaIranIraqIrelandIsraelItalyJamaicaJapanJordanKazakhstanKenyaKoreaKuwaitLaosLatin AmericaLatviaLebanonLiberiaLithuaniaMalaysiaMexicoMicronesiaMiddle AfricaMoldovaMoroccoNepalNetherlandsNicaraguaNigeriaNorth AmericaNorth MacedoniaNorthern AfricaNorthern EuropeNorwayOceaniaPakistanPanamaPeruPhilippinesPolandPortugalRomaniaRussiaSaudi ArabiaScotlandSenegalSerbiaSierra LeoneSingaporeSomaliaSouth AfricaSouth AmericaSouth Central AsiaSouth Eastern AsiaSouthern EuropeSpainSri LankaSt. Vincent and the GrenadinesSudanSwedenSwitzerlandSyriaTaiwanThailandTrinidad and TobagoTurkeyUgandaUkraineUruguayUzbekistanVenezuelaVietnamWest IndiesWestern AfricaWestern AsiaWestern EuropeYemenZaireZimbabweAzores
6th Grade
Income
Poverty
Unemployment
Labor Participation
Family Structure
Vehicle Availability
Education Level
Disability

6th Grade Comparison

Immigrants from Czechoslovakia

Bahamians

Exceptional
Tragic
97.4%
6TH GRADE
97.3/ 100
METRIC RATING
109th/ 347
METRIC RANK
96.7%
6TH GRADE
4.8/ 100
METRIC RATING
223rd/ 347
METRIC RANK

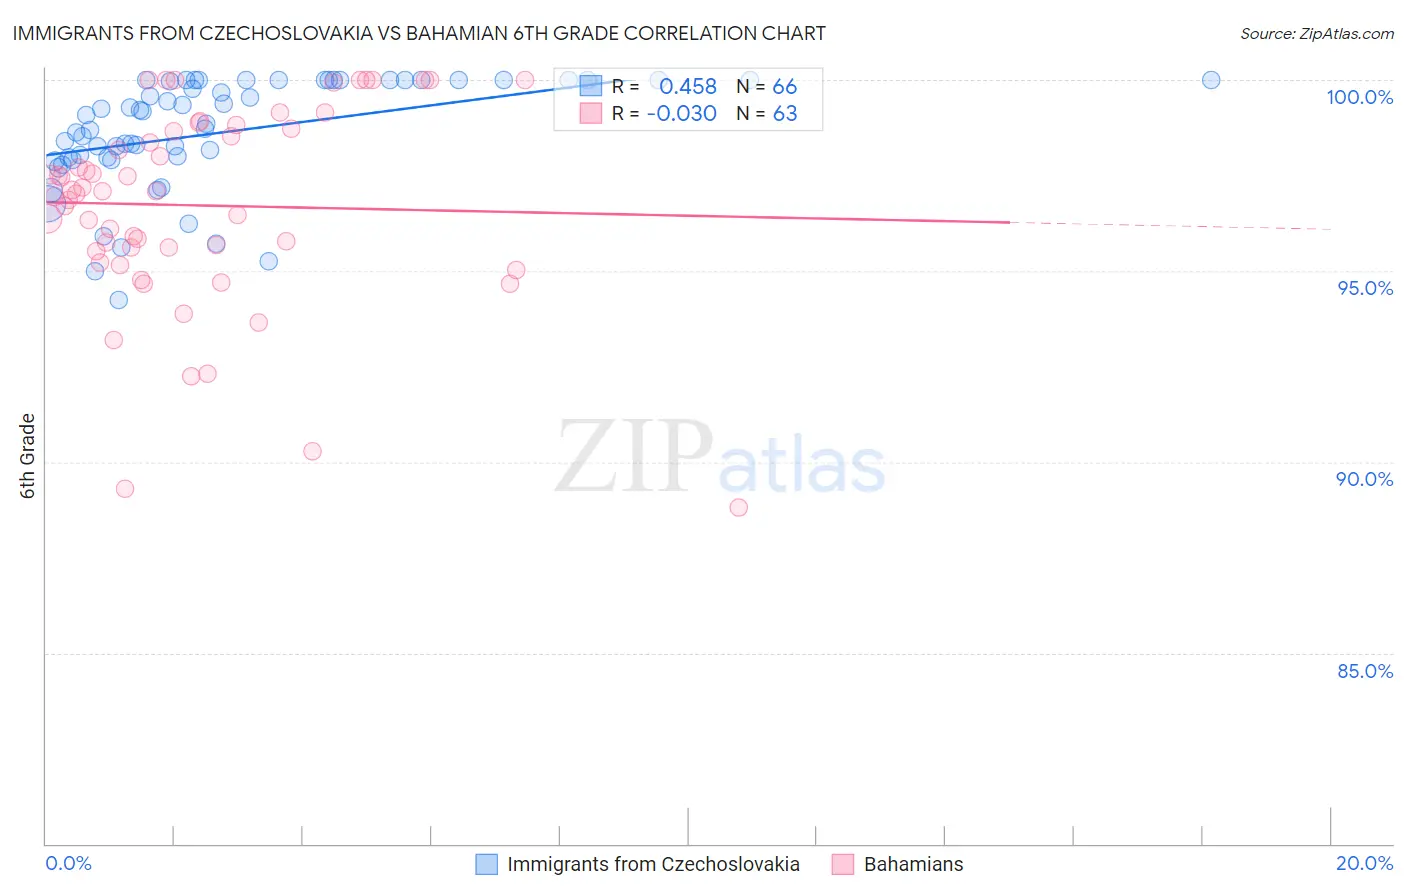
Immigrants from Czechoslovakia vs Bahamian 6th Grade Correlation Chart

The statistical analysis conducted on geographies consisting of 195,448,060 people shows a moderate positive correlation between the proportion of Immigrants from Czechoslovakia and percentage of population with at least 6th grade education in the United States with a correlation coefficient (R) of 0.458 and weighted average of 97.4%. Similarly, the statistical analysis conducted on geographies consisting of 112,698,819 people shows no correlation between the proportion of Bahamians and percentage of population with at least 6th grade education in the United States with a correlation coefficient (R) of -0.030 and weighted average of 96.7%, a difference of 0.75%.
Immigrants from Czechoslovakia vs Bahamian 6th Grade

6th Grade Correlation Summary

MeasurementImmigrants from CzechoslovakiaBahamian
Minimum94.3%88.8%
Maximum100.0%100.0%
Range5.7%11.2%
Mean98.6%96.7%
Median99.0%97.1%
Interquartile 25% (IQ1)98.0%95.5%
Interquartile 75% (IQ3)100.0%98.7%
Interquartile Range (IQR)2.0%3.2%
Standard Deviation (Sample)1.5%2.6%
Standard Deviation (Population)1.4%2.6%

Similar Demographics by 6th Grade

Demographics Similar to Immigrants from Czechoslovakia by 6th Grade

In terms of 6th grade, the demographic groups most similar to Immigrants from Czechoslovakia are Nonimmigrants (97.4%, a difference of 0.0%), Immigrants from Singapore (97.5%, a difference of 0.010%), Menominee (97.5%, a difference of 0.020%), Thai (97.4%, a difference of 0.020%), and Iroquois (97.4%, a difference of 0.020%).
DemographicsRating | Rank6th Grade
Choctaw
98.0
/100
|
#102
Exceptional
97.5%
Bhutanese
98.0
/100
|
#103
Exceptional
97.5%
German Russians
97.9
/100
|
#104
Exceptional
97.5%
Cheyenne
97.9
/100
|
#105
Exceptional
97.5%
Menominee
97.7
/100
|
#106
Exceptional
97.5%
Immigrants | Singapore
97.6
/100
|
#107
Exceptional
97.5%
Immigrants | Nonimmigrants
97.3
/100
|
#108
Exceptional
97.4%
Immigrants | Czechoslovakia
97.3
/100
|
#109
Exceptional
97.4%
Thais
96.9
/100
|
#110
Exceptional
97.4%
Iroquois
96.9
/100
|
#111
Exceptional
97.4%
Immigrants | Latvia
96.7
/100
|
#112
Exceptional
97.4%
Immigrants | Saudi Arabia
96.5
/100
|
#113
Exceptional
97.4%
Colville
96.4
/100
|
#114
Exceptional
97.4%
Immigrants | Switzerland
95.7
/100
|
#115
Exceptional
97.4%
Lebanese
95.5
/100
|
#116
Exceptional
97.4%

Demographics Similar to Bahamians by 6th Grade

In terms of 6th grade, the demographic groups most similar to Bahamians are Immigrants from Southern Europe (96.7%, a difference of 0.010%), Immigrants from Pakistan (96.7%, a difference of 0.010%), Immigrants from Panama (96.7%, a difference of 0.010%), Immigrants from Western Asia (96.7%, a difference of 0.020%), and Immigrants from Malaysia (96.7%, a difference of 0.020%).
DemographicsRating | Rank6th Grade
Paiute
7.8
/100
|
#216
Tragic
96.8%
Liberians
7.5
/100
|
#217
Tragic
96.8%
Navajo
7.3
/100
|
#218
Tragic
96.8%
Costa Ricans
6.8
/100
|
#219
Tragic
96.8%
Immigrants | Morocco
6.2
/100
|
#220
Tragic
96.7%
Tongans
6.1
/100
|
#221
Tragic
96.7%
Immigrants | Syria
5.9
/100
|
#222
Tragic
96.7%
Bahamians
4.8
/100
|
#223
Tragic
96.7%
Immigrants | Southern Europe
4.4
/100
|
#224
Tragic
96.7%
Immigrants | Pakistan
4.4
/100
|
#225
Tragic
96.7%
Immigrants | Panama
4.2
/100
|
#226
Tragic
96.7%
Immigrants | Western Asia
4.1
/100
|
#227
Tragic
96.7%
Immigrants | Malaysia
4.0
/100
|
#228
Tragic
96.7%
Assyrians/Chaldeans/Syriacs
4.0
/100
|
#229
Tragic
96.7%
Immigrants | Eastern Asia
4.0
/100
|
#230
Tragic
96.7%