Immigrants from Cuba vs Zimbabwean 7th Grade
COMPARE
Immigrants from Cuba
Zimbabwean
7th Grade
7th Grade Comparison
Immigrants from Cuba
Zimbabweans
93.8%
7TH GRADE
0.0/ 100
METRIC RATING
317th/ 347
METRIC RANK
96.8%
7TH GRADE
99.5/ 100
METRIC RATING
75th/ 347
METRIC RANK
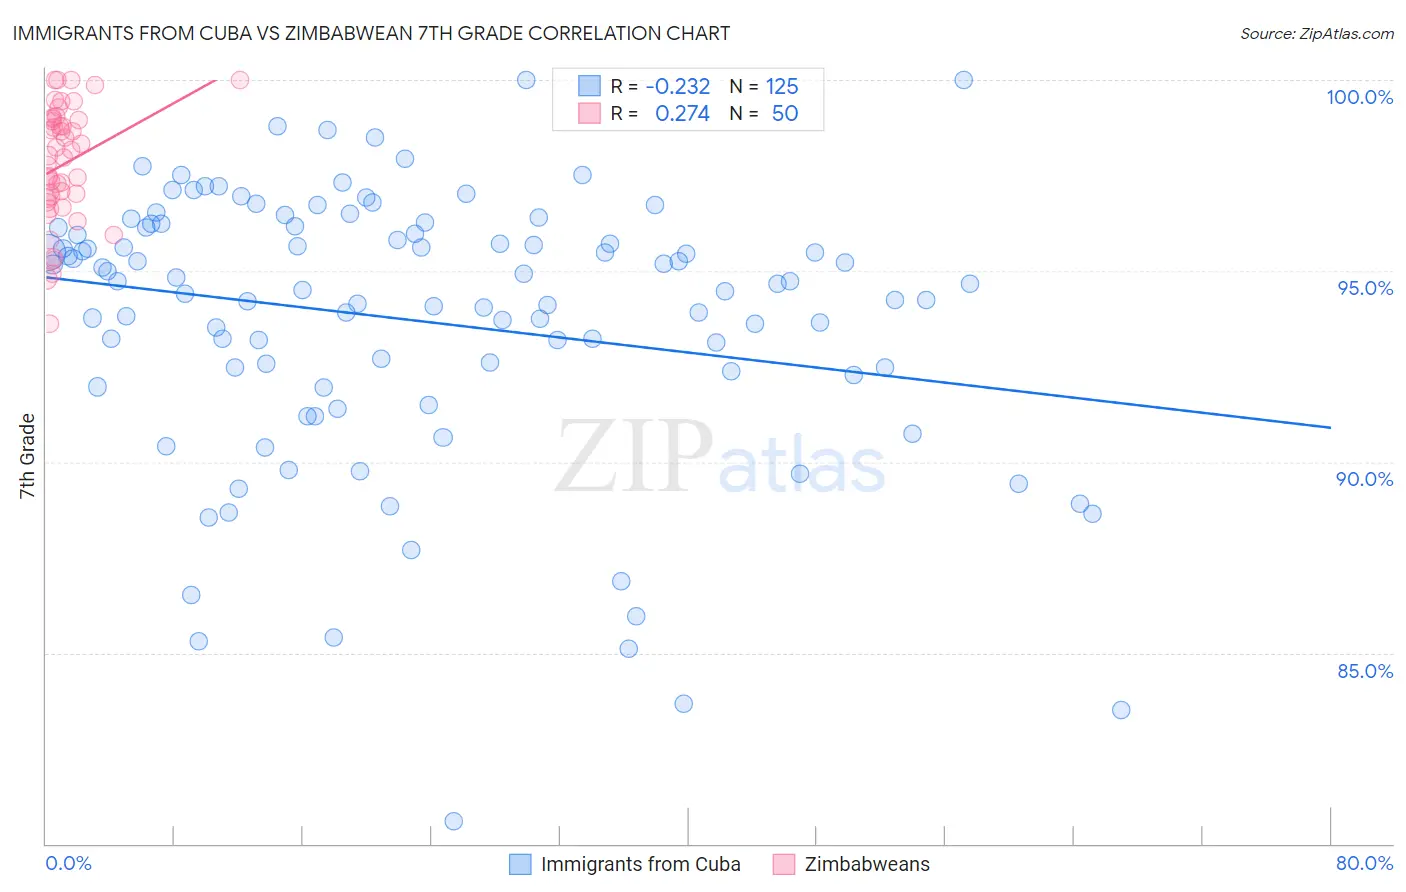
Immigrants from Cuba vs Zimbabwean 7th Grade Correlation Chart
The statistical analysis conducted on geographies consisting of 326,028,159 people shows a weak negative correlation between the proportion of Immigrants from Cuba and percentage of population with at least 7th grade education in the United States with a correlation coefficient (R) of -0.232 and weighted average of 93.8%. Similarly, the statistical analysis conducted on geographies consisting of 69,201,950 people shows a weak positive correlation between the proportion of Zimbabweans and percentage of population with at least 7th grade education in the United States with a correlation coefficient (R) of 0.274 and weighted average of 96.8%, a difference of 3.2%.
7th Grade Correlation Summary
| Measurement | Immigrants from Cuba | Zimbabwean |
| Minimum | 80.6% | 93.6% |
| Maximum | 100.0% | 100.0% |
| Range | 19.4% | 6.4% |
| Mean | 93.7% | 97.8% |
| Median | 94.7% | 98.0% |
| Interquartile 25% (IQ1) | 92.3% | 96.9% |
| Interquartile 75% (IQ3) | 96.1% | 98.9% |
| Interquartile Range (IQR) | 3.8% | 2.1% |
| Standard Deviation (Sample) | 3.6% | 1.5% |
| Standard Deviation (Population) | 3.6% | 1.5% |
Similar Demographics by 7th Grade
Demographics Similar to Immigrants from Cuba by 7th Grade
In terms of 7th grade, the demographic groups most similar to Immigrants from Cuba are Immigrants from Ecuador (93.7%, a difference of 0.080%), Immigrants from Vietnam (93.9%, a difference of 0.090%), Vietnamese (93.9%, a difference of 0.11%), Immigrants from Cambodia (93.7%, a difference of 0.11%), and Japanese (94.0%, a difference of 0.17%).
| Demographics | Rating | Rank | 7th Grade |
| Immigrants | Caribbean | 0.0 /100 | #310 | Tragic 94.0% |
| Puerto Ricans | 0.0 /100 | #311 | Tragic 94.0% |
| Immigrants | Immigrants | 0.0 /100 | #312 | Tragic 94.0% |
| Immigrants | Bangladesh | 0.0 /100 | #313 | Tragic 94.0% |
| Japanese | 0.0 /100 | #314 | Tragic 94.0% |
| Vietnamese | 0.0 /100 | #315 | Tragic 93.9% |
| Immigrants | Vietnam | 0.0 /100 | #316 | Tragic 93.9% |
| Immigrants | Cuba | 0.0 /100 | #317 | Tragic 93.8% |
| Immigrants | Ecuador | 0.0 /100 | #318 | Tragic 93.7% |
| Immigrants | Cambodia | 0.0 /100 | #319 | Tragic 93.7% |
| Immigrants | Fiji | 0.0 /100 | #320 | Tragic 93.5% |
| Belizeans | 0.0 /100 | #321 | Tragic 93.5% |
| Nicaraguans | 0.0 /100 | #322 | Tragic 93.5% |
| Immigrants | Belize | 0.0 /100 | #323 | Tragic 93.4% |
| Dominicans | 0.0 /100 | #324 | Tragic 93.3% |
Demographics Similar to Zimbabweans by 7th Grade
In terms of 7th grade, the demographic groups most similar to Zimbabweans are Immigrants from England (96.8%, a difference of 0.0%), Arapaho (96.8%, a difference of 0.010%), Immigrants from Ireland (96.8%, a difference of 0.020%), Cherokee (96.8%, a difference of 0.020%), and Cajun (96.8%, a difference of 0.030%).
| Demographics | Rating | Rank | 7th Grade |
| Immigrants | India | 99.6 /100 | #68 | Exceptional 96.9% |
| Iranians | 99.6 /100 | #69 | Exceptional 96.8% |
| New Zealanders | 99.6 /100 | #70 | Exceptional 96.8% |
| Immigrants | Lithuania | 99.6 /100 | #71 | Exceptional 96.8% |
| Cajuns | 99.5 /100 | #72 | Exceptional 96.8% |
| Arapaho | 99.5 /100 | #73 | Exceptional 96.8% |
| Immigrants | England | 99.5 /100 | #74 | Exceptional 96.8% |
| Zimbabweans | 99.5 /100 | #75 | Exceptional 96.8% |
| Immigrants | Ireland | 99.4 /100 | #76 | Exceptional 96.8% |
| Cherokee | 99.4 /100 | #77 | Exceptional 96.8% |
| Immigrants | Netherlands | 99.3 /100 | #78 | Exceptional 96.8% |
| Cypriots | 99.3 /100 | #79 | Exceptional 96.8% |
| Yugoslavians | 99.3 /100 | #80 | Exceptional 96.8% |
| Delaware | 99.2 /100 | #81 | Exceptional 96.8% |
| Chickasaw | 99.2 /100 | #82 | Exceptional 96.7% |