Immigrants from Croatia vs Potawatomi Associate's Degree
COMPARE
Immigrants from Croatia
Potawatomi
Associate's Degree
Associate's Degree Comparison
Immigrants from Croatia
Potawatomi
50.2%
ASSOCIATE'S DEGREE
98.9/ 100
METRIC RATING
86th/ 347
METRIC RANK
40.4%
ASSOCIATE'S DEGREE
0.1/ 100
METRIC RATING
275th/ 347
METRIC RANK
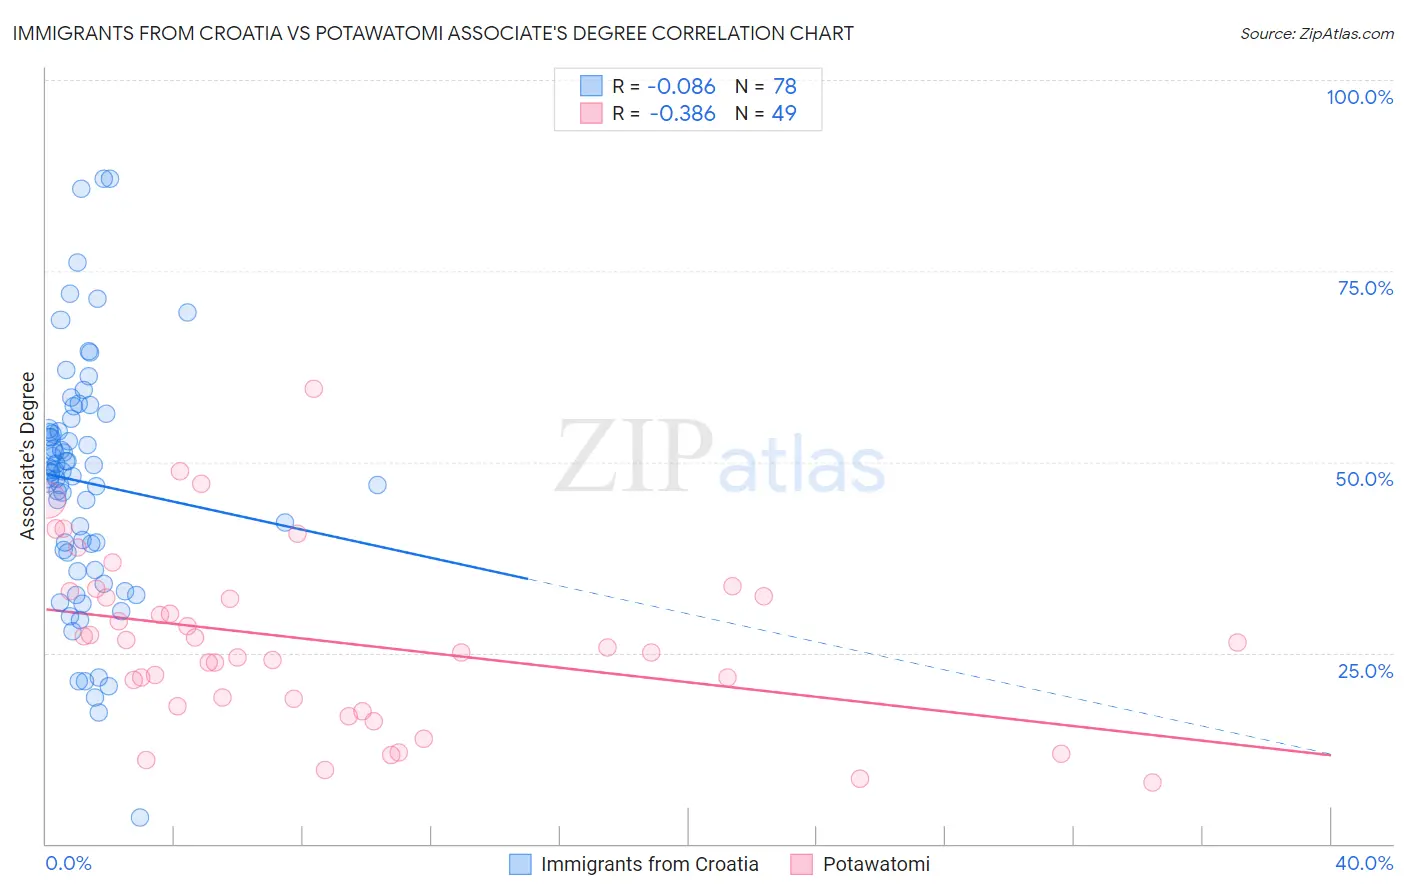
Immigrants from Croatia vs Potawatomi Associate's Degree Correlation Chart
The statistical analysis conducted on geographies consisting of 132,578,161 people shows a slight negative correlation between the proportion of Immigrants from Croatia and percentage of population with at least associate's degree education in the United States with a correlation coefficient (R) of -0.086 and weighted average of 50.2%. Similarly, the statistical analysis conducted on geographies consisting of 117,773,349 people shows a mild negative correlation between the proportion of Potawatomi and percentage of population with at least associate's degree education in the United States with a correlation coefficient (R) of -0.386 and weighted average of 40.4%, a difference of 24.3%.
Associate's Degree Correlation Summary
| Measurement | Immigrants from Croatia | Potawatomi |
| Minimum | 3.4% | 8.0% |
| Maximum | 87.1% | 59.6% |
| Range | 83.7% | 51.6% |
| Mean | 47.3% | 26.5% |
| Median | 48.7% | 25.7% |
| Interquartile 25% (IQ1) | 38.1% | 18.5% |
| Interquartile 75% (IQ3) | 54.3% | 32.7% |
| Interquartile Range (IQR) | 16.2% | 14.3% |
| Standard Deviation (Sample) | 15.9% | 11.3% |
| Standard Deviation (Population) | 15.8% | 11.2% |
Similar Demographics by Associate's Degree
Demographics Similar to Immigrants from Croatia by Associate's Degree
In terms of associate's degree, the demographic groups most similar to Immigrants from Croatia are Immigrants from Egypt (50.2%, a difference of 0.010%), Immigrants from Hungary (50.2%, a difference of 0.060%), Immigrants from Uzbekistan (50.3%, a difference of 0.080%), Greek (50.3%, a difference of 0.12%), and Immigrants from Moldova (50.2%, a difference of 0.12%).
| Demographics | Rating | Rank | Associate's Degree |
| Ethiopians | 99.1 /100 | #79 | Exceptional 50.4% |
| Armenians | 99.1 /100 | #80 | Exceptional 50.4% |
| Maltese | 99.1 /100 | #81 | Exceptional 50.4% |
| Greeks | 98.9 /100 | #82 | Exceptional 50.3% |
| Immigrants | Uzbekistan | 98.9 /100 | #83 | Exceptional 50.3% |
| Immigrants | Hungary | 98.9 /100 | #84 | Exceptional 50.2% |
| Immigrants | Egypt | 98.9 /100 | #85 | Exceptional 50.2% |
| Immigrants | Croatia | 98.9 /100 | #86 | Exceptional 50.2% |
| Immigrants | Moldova | 98.8 /100 | #87 | Exceptional 50.2% |
| Immigrants | Canada | 98.7 /100 | #88 | Exceptional 50.1% |
| Immigrants | Western Europe | 98.7 /100 | #89 | Exceptional 50.1% |
| Immigrants | Ethiopia | 98.7 /100 | #90 | Exceptional 50.1% |
| Immigrants | Western Asia | 98.7 /100 | #91 | Exceptional 50.1% |
| Immigrants | North America | 98.7 /100 | #92 | Exceptional 50.1% |
| Immigrants | Brazil | 98.5 /100 | #93 | Exceptional 50.0% |
Demographics Similar to Potawatomi by Associate's Degree
In terms of associate's degree, the demographic groups most similar to Potawatomi are Puerto Rican (40.4%, a difference of 0.10%), Immigrants from Dominica (40.5%, a difference of 0.14%), Blackfeet (40.3%, a difference of 0.16%), Puget Sound Salish (40.5%, a difference of 0.28%), and Ottawa (40.3%, a difference of 0.30%).
| Demographics | Rating | Rank | Associate's Degree |
| Central American Indians | 0.2 /100 | #268 | Tragic 40.8% |
| Americans | 0.2 /100 | #269 | Tragic 40.8% |
| Chippewa | 0.2 /100 | #270 | Tragic 40.7% |
| Immigrants | Laos | 0.1 /100 | #271 | Tragic 40.7% |
| Belizeans | 0.1 /100 | #272 | Tragic 40.6% |
| Puget Sound Salish | 0.1 /100 | #273 | Tragic 40.5% |
| Immigrants | Dominica | 0.1 /100 | #274 | Tragic 40.5% |
| Potawatomi | 0.1 /100 | #275 | Tragic 40.4% |
| Puerto Ricans | 0.1 /100 | #276 | Tragic 40.4% |
| Blackfeet | 0.1 /100 | #277 | Tragic 40.3% |
| Ottawa | 0.1 /100 | #278 | Tragic 40.3% |
| Immigrants | Nicaragua | 0.1 /100 | #279 | Tragic 40.3% |
| Immigrants | Micronesia | 0.1 /100 | #280 | Tragic 40.2% |
| Immigrants | Portugal | 0.1 /100 | #281 | Tragic 40.1% |
| Bangladeshis | 0.1 /100 | #282 | Tragic 40.0% |