Immigrants from Costa Rica vs Immigrants from Southern Europe 12th Grade, No Diploma
COMPARE
Immigrants from Costa Rica
Immigrants from Southern Europe
12th Grade, No Diploma
12th Grade, No Diploma Comparison
Immigrants from Costa Rica
Immigrants from Southern Europe
90.0%
12TH GRADE, NO DIPLOMA
1.6/ 100
METRIC RATING
242nd/ 347
METRIC RANK
90.8%
12TH GRADE, NO DIPLOMA
19.9/ 100
METRIC RATING
199th/ 347
METRIC RANK
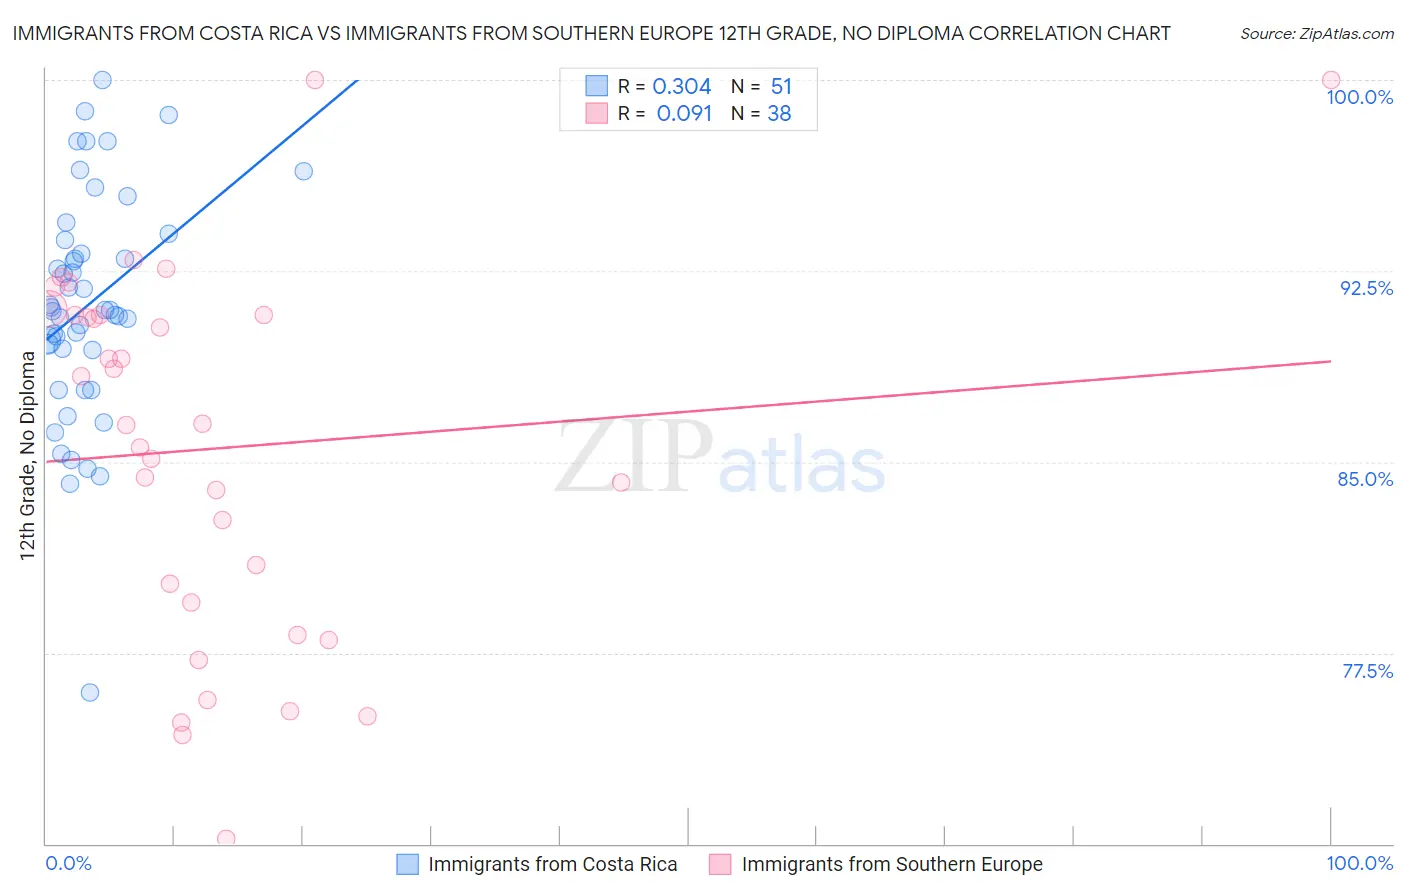
Immigrants from Costa Rica vs Immigrants from Southern Europe 12th Grade, No Diploma Correlation Chart
The statistical analysis conducted on geographies consisting of 204,277,241 people shows a mild positive correlation between the proportion of Immigrants from Costa Rica and percentage of population with at least 12th grade (no diploma) education in the United States with a correlation coefficient (R) of 0.304 and weighted average of 90.0%. Similarly, the statistical analysis conducted on geographies consisting of 402,804,595 people shows a slight positive correlation between the proportion of Immigrants from Southern Europe and percentage of population with at least 12th grade (no diploma) education in the United States with a correlation coefficient (R) of 0.091 and weighted average of 90.8%, a difference of 0.85%.
12th Grade, No Diploma Correlation Summary
| Measurement | Immigrants from Costa Rica | Immigrants from Southern Europe |
| Minimum | 76.0% | 70.2% |
| Maximum | 100.0% | 100.0% |
| Range | 24.0% | 29.8% |
| Mean | 91.2% | 85.5% |
| Median | 91.0% | 86.5% |
| Interquartile 25% (IQ1) | 89.4% | 79.5% |
| Interquartile 75% (IQ3) | 93.7% | 90.8% |
| Interquartile Range (IQR) | 4.3% | 11.3% |
| Standard Deviation (Sample) | 4.5% | 7.3% |
| Standard Deviation (Population) | 4.4% | 7.2% |
Similar Demographics by 12th Grade, No Diploma
Demographics Similar to Immigrants from Costa Rica by 12th Grade, No Diploma
In terms of 12th grade, no diploma, the demographic groups most similar to Immigrants from Costa Rica are Crow (90.0%, a difference of 0.010%), Taiwanese (90.0%, a difference of 0.010%), Kiowa (90.0%, a difference of 0.030%), Immigrants from Middle Africa (90.0%, a difference of 0.030%), and Immigrants from Uruguay (90.0%, a difference of 0.050%).
| Demographics | Rating | Rank | 12th Grade, No Diploma |
| Colville | 2.3 /100 | #235 | Tragic 90.1% |
| Immigrants | Uzbekistan | 2.2 /100 | #236 | Tragic 90.1% |
| Immigrants | Colombia | 2.1 /100 | #237 | Tragic 90.1% |
| Inupiat | 2.0 /100 | #238 | Tragic 90.1% |
| Sub-Saharan Africans | 1.9 /100 | #239 | Tragic 90.1% |
| Kiowa | 1.7 /100 | #240 | Tragic 90.0% |
| Immigrants | Middle Africa | 1.7 /100 | #241 | Tragic 90.0% |
| Immigrants | Costa Rica | 1.6 /100 | #242 | Tragic 90.0% |
| Crow | 1.5 /100 | #243 | Tragic 90.0% |
| Taiwanese | 1.5 /100 | #244 | Tragic 90.0% |
| Immigrants | Uruguay | 1.4 /100 | #245 | Tragic 90.0% |
| Ghanaians | 1.3 /100 | #246 | Tragic 90.0% |
| Immigrants | Nigeria | 1.3 /100 | #247 | Tragic 89.9% |
| Comanche | 1.1 /100 | #248 | Tragic 89.9% |
| Senegalese | 1.1 /100 | #249 | Tragic 89.9% |
Demographics Similar to Immigrants from Southern Europe by 12th Grade, No Diploma
In terms of 12th grade, no diploma, the demographic groups most similar to Immigrants from Southern Europe are Liberian (90.8%, a difference of 0.0%), Hawaiian (90.8%, a difference of 0.0%), Samoan (90.8%, a difference of 0.010%), Marshallese (90.7%, a difference of 0.030%), and Panamanian (90.8%, a difference of 0.050%).
| Demographics | Rating | Rank | 12th Grade, No Diploma |
| Immigrants | Eastern Africa | 27.7 /100 | #192 | Fair 90.9% |
| Immigrants | Ethiopia | 27.2 /100 | #193 | Fair 90.9% |
| Immigrants | Oceania | 26.0 /100 | #194 | Fair 90.9% |
| Koreans | 24.5 /100 | #195 | Fair 90.8% |
| Panamanians | 22.8 /100 | #196 | Fair 90.8% |
| Immigrants | Sudan | 22.6 /100 | #197 | Fair 90.8% |
| Samoans | 20.4 /100 | #198 | Fair 90.8% |
| Immigrants | Southern Europe | 19.9 /100 | #199 | Poor 90.8% |
| Liberians | 19.8 /100 | #200 | Poor 90.8% |
| Hawaiians | 19.7 /100 | #201 | Poor 90.8% |
| Marshallese | 18.2 /100 | #202 | Poor 90.7% |
| Tongans | 16.1 /100 | #203 | Poor 90.7% |
| French American Indians | 15.5 /100 | #204 | Poor 90.7% |
| Immigrants | Sierra Leone | 14.9 /100 | #205 | Poor 90.7% |
| Immigrants | Bolivia | 12.3 /100 | #206 | Poor 90.6% |