Immigrants from Costa Rica vs Immigrants from Dominican Republic 4th Grade
COMPARE
Immigrants from Costa Rica
Immigrants from Dominican Republic
4th Grade
4th Grade Comparison
Immigrants from Costa Rica
Immigrants from Dominican Republic
97.2%
4TH GRADE
2.0/ 100
METRIC RATING
237th/ 347
METRIC RANK
95.7%
4TH GRADE
0.0/ 100
METRIC RATING
333rd/ 347
METRIC RANK
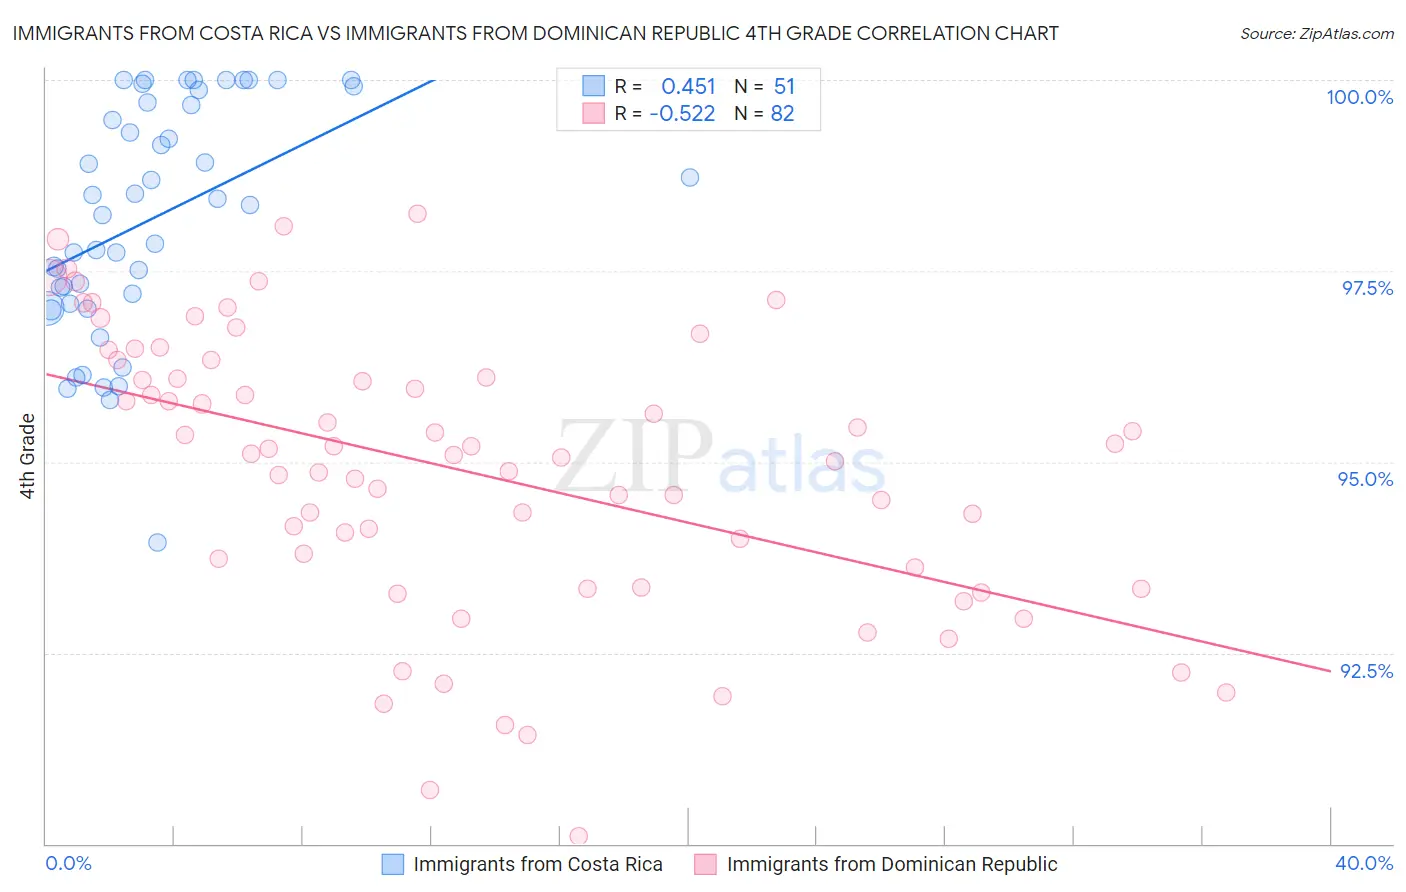
Immigrants from Costa Rica vs Immigrants from Dominican Republic 4th Grade Correlation Chart
The statistical analysis conducted on geographies consisting of 204,275,869 people shows a moderate positive correlation between the proportion of Immigrants from Costa Rica and percentage of population with at least 4th grade education in the United States with a correlation coefficient (R) of 0.451 and weighted average of 97.2%. Similarly, the statistical analysis conducted on geographies consisting of 275,142,551 people shows a substantial negative correlation between the proportion of Immigrants from Dominican Republic and percentage of population with at least 4th grade education in the United States with a correlation coefficient (R) of -0.522 and weighted average of 95.7%, a difference of 1.5%.
4th Grade Correlation Summary
| Measurement | Immigrants from Costa Rica | Immigrants from Dominican Republic |
| Minimum | 93.9% | 90.1% |
| Maximum | 100.0% | 98.3% |
| Range | 6.1% | 8.1% |
| Mean | 98.2% | 94.9% |
| Median | 98.4% | 95.1% |
| Interquartile 25% (IQ1) | 97.1% | 93.6% |
| Interquartile 75% (IQ3) | 99.7% | 96.1% |
| Interquartile Range (IQR) | 2.6% | 2.5% |
| Standard Deviation (Sample) | 1.5% | 1.8% |
| Standard Deviation (Population) | 1.5% | 1.8% |
Similar Demographics by 4th Grade
Demographics Similar to Immigrants from Costa Rica by 4th Grade
In terms of 4th grade, the demographic groups most similar to Immigrants from Costa Rica are Indian (Asian) (97.2%, a difference of 0.0%), Nigerian (97.1%, a difference of 0.010%), Colombian (97.1%, a difference of 0.020%), Immigrants from Eastern Asia (97.2%, a difference of 0.030%), and Immigrants from Indonesia (97.1%, a difference of 0.030%).
| Demographics | Rating | Rank | 4th Grade |
| Uruguayans | 3.5 /100 | #230 | Tragic 97.2% |
| Immigrants | Malaysia | 3.4 /100 | #231 | Tragic 97.2% |
| Immigrants | Western Asia | 3.4 /100 | #232 | Tragic 97.2% |
| Senegalese | 3.1 /100 | #233 | Tragic 97.2% |
| Assyrians/Chaldeans/Syriacs | 3.0 /100 | #234 | Tragic 97.2% |
| Yuman | 2.9 /100 | #235 | Tragic 97.2% |
| Immigrants | Eastern Asia | 2.7 /100 | #236 | Tragic 97.2% |
| Immigrants | Costa Rica | 2.0 /100 | #237 | Tragic 97.2% |
| Indians (Asian) | 1.9 /100 | #238 | Tragic 97.2% |
| Nigerians | 1.8 /100 | #239 | Tragic 97.1% |
| Colombians | 1.6 /100 | #240 | Tragic 97.1% |
| Immigrants | Indonesia | 1.5 /100 | #241 | Tragic 97.1% |
| Asians | 1.4 /100 | #242 | Tragic 97.1% |
| U.S. Virgin Islanders | 1.4 /100 | #243 | Tragic 97.1% |
| Koreans | 1.3 /100 | #244 | Tragic 97.1% |
Demographics Similar to Immigrants from Dominican Republic by 4th Grade
In terms of 4th grade, the demographic groups most similar to Immigrants from Dominican Republic are Immigrants from Cabo Verde (95.7%, a difference of 0.0%), Immigrants from Honduras (95.8%, a difference of 0.050%), Immigrants from Armenia (95.8%, a difference of 0.060%), Immigrants from Latin America (95.7%, a difference of 0.070%), and Immigrants from Cambodia (95.8%, a difference of 0.11%).
| Demographics | Rating | Rank | 4th Grade |
| Hispanics or Latinos | 0.0 /100 | #326 | Tragic 96.0% |
| Hondurans | 0.0 /100 | #327 | Tragic 96.0% |
| Mexican American Indians | 0.0 /100 | #328 | Tragic 95.8% |
| Immigrants | Cambodia | 0.0 /100 | #329 | Tragic 95.8% |
| Immigrants | Fiji | 0.0 /100 | #330 | Tragic 95.8% |
| Immigrants | Armenia | 0.0 /100 | #331 | Tragic 95.8% |
| Immigrants | Honduras | 0.0 /100 | #332 | Tragic 95.8% |
| Immigrants | Dominican Republic | 0.0 /100 | #333 | Tragic 95.7% |
| Immigrants | Cabo Verde | 0.0 /100 | #334 | Tragic 95.7% |
| Immigrants | Latin America | 0.0 /100 | #335 | Tragic 95.7% |
| Mexicans | 0.0 /100 | #336 | Tragic 95.6% |
| Central Americans | 0.0 /100 | #337 | Tragic 95.5% |
| Nepalese | 0.0 /100 | #338 | Tragic 95.5% |
| Guatemalans | 0.0 /100 | #339 | Tragic 95.3% |
| Yakama | 0.0 /100 | #340 | Tragic 95.2% |