Immigrants from Congo vs Armenian Associate's Degree
COMPARE
Immigrants from Congo
Armenian
Associate's Degree
Associate's Degree Comparison
Immigrants from Congo
Armenians
41.8%
ASSOCIATE'S DEGREE
0.5/ 100
METRIC RATING
256th/ 347
METRIC RANK
50.4%
ASSOCIATE'S DEGREE
99.1/ 100
METRIC RATING
80th/ 347
METRIC RANK
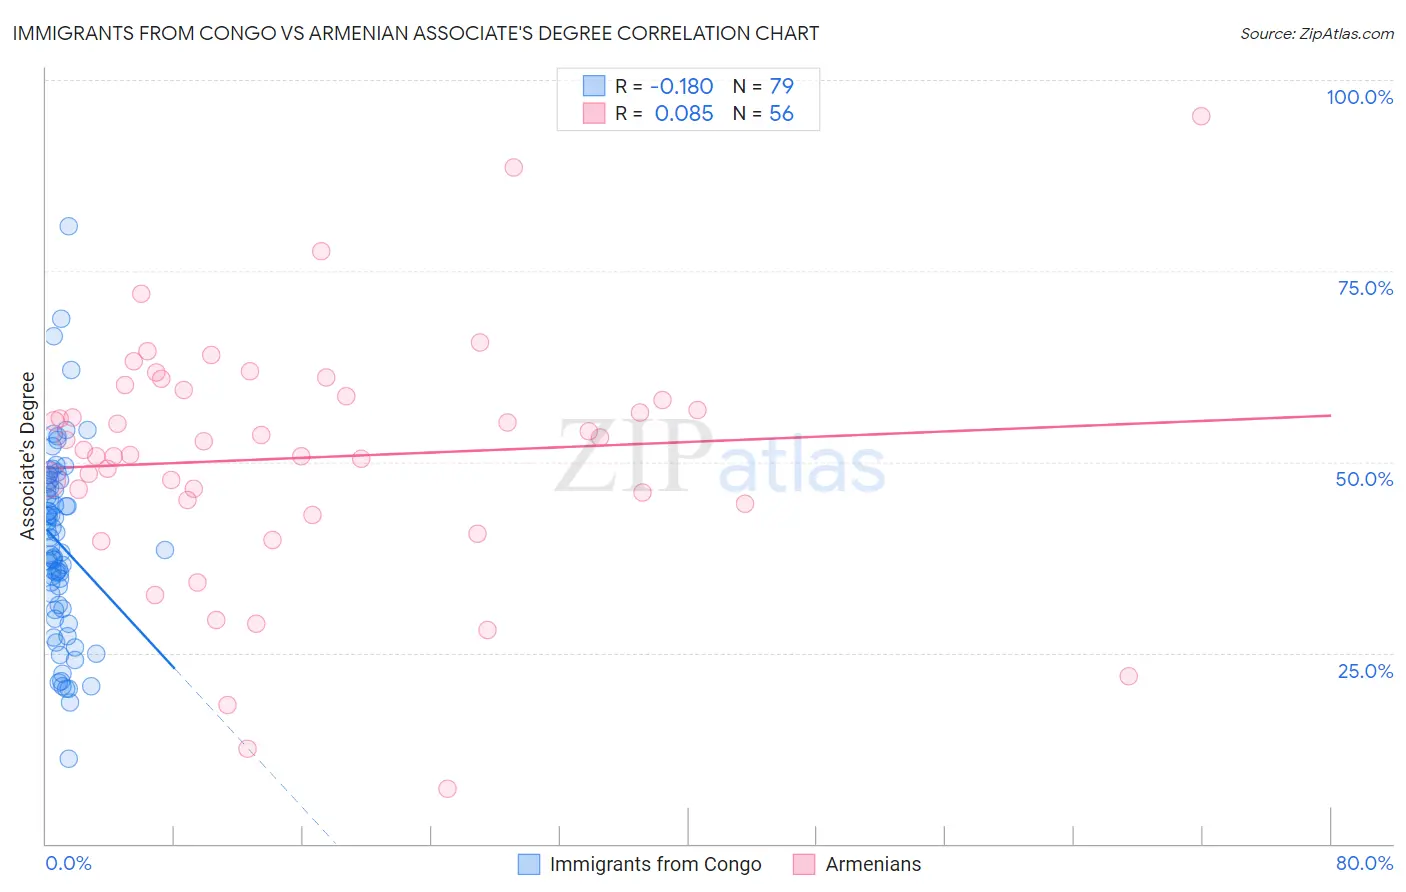
Immigrants from Congo vs Armenian Associate's Degree Correlation Chart
The statistical analysis conducted on geographies consisting of 92,128,730 people shows a poor negative correlation between the proportion of Immigrants from Congo and percentage of population with at least associate's degree education in the United States with a correlation coefficient (R) of -0.180 and weighted average of 41.8%. Similarly, the statistical analysis conducted on geographies consisting of 310,941,710 people shows a slight positive correlation between the proportion of Armenians and percentage of population with at least associate's degree education in the United States with a correlation coefficient (R) of 0.085 and weighted average of 50.4%, a difference of 20.7%.
Associate's Degree Correlation Summary
| Measurement | Immigrants from Congo | Armenian |
| Minimum | 11.1% | 7.2% |
| Maximum | 80.9% | 95.3% |
| Range | 69.7% | 88.1% |
| Mean | 39.3% | 50.6% |
| Median | 39.0% | 52.1% |
| Interquartile 25% (IQ1) | 30.7% | 44.7% |
| Interquartile 75% (IQ3) | 47.3% | 59.0% |
| Interquartile Range (IQR) | 16.6% | 14.3% |
| Standard Deviation (Sample) | 12.3% | 16.0% |
| Standard Deviation (Population) | 12.2% | 15.9% |
Similar Demographics by Associate's Degree
Demographics Similar to Immigrants from Congo by Associate's Degree
In terms of associate's degree, the demographic groups most similar to Immigrants from Congo are Spanish American (41.8%, a difference of 0.060%), Immigrants from Guyana (41.8%, a difference of 0.12%), Cuban (41.9%, a difference of 0.21%), Japanese (41.7%, a difference of 0.27%), and Indonesian (41.9%, a difference of 0.28%).
| Demographics | Rating | Rank | Associate's Degree |
| Jamaicans | 0.7 /100 | #249 | Tragic 42.1% |
| U.S. Virgin Islanders | 0.7 /100 | #250 | Tragic 42.1% |
| Immigrants | Bahamas | 0.7 /100 | #251 | Tragic 42.1% |
| French American Indians | 0.6 /100 | #252 | Tragic 42.0% |
| Indonesians | 0.6 /100 | #253 | Tragic 41.9% |
| Cubans | 0.6 /100 | #254 | Tragic 41.9% |
| Immigrants | Guyana | 0.5 /100 | #255 | Tragic 41.8% |
| Immigrants | Congo | 0.5 /100 | #256 | Tragic 41.8% |
| Spanish Americans | 0.5 /100 | #257 | Tragic 41.8% |
| Japanese | 0.5 /100 | #258 | Tragic 41.7% |
| Malaysians | 0.4 /100 | #259 | Tragic 41.6% |
| Marshallese | 0.4 /100 | #260 | Tragic 41.6% |
| Nicaraguans | 0.4 /100 | #261 | Tragic 41.5% |
| Bahamians | 0.4 /100 | #262 | Tragic 41.5% |
| Immigrants | Jamaica | 0.3 /100 | #263 | Tragic 41.5% |
Demographics Similar to Armenians by Associate's Degree
In terms of associate's degree, the demographic groups most similar to Armenians are Ethiopian (50.4%, a difference of 0.030%), Immigrants from Eastern Europe (50.5%, a difference of 0.050%), Maltese (50.4%, a difference of 0.070%), Immigrants from Lebanon (50.5%, a difference of 0.090%), and Immigrants from Zimbabwe (50.5%, a difference of 0.12%).
| Demographics | Rating | Rank | Associate's Degree |
| Carpatho Rusyns | 99.3 /100 | #73 | Exceptional 50.6% |
| Lithuanians | 99.3 /100 | #74 | Exceptional 50.6% |
| Immigrants | Scotland | 99.3 /100 | #75 | Exceptional 50.6% |
| Immigrants | Zimbabwe | 99.2 /100 | #76 | Exceptional 50.5% |
| Immigrants | Lebanon | 99.1 /100 | #77 | Exceptional 50.5% |
| Immigrants | Eastern Europe | 99.1 /100 | #78 | Exceptional 50.5% |
| Ethiopians | 99.1 /100 | #79 | Exceptional 50.4% |
| Armenians | 99.1 /100 | #80 | Exceptional 50.4% |
| Maltese | 99.1 /100 | #81 | Exceptional 50.4% |
| Greeks | 98.9 /100 | #82 | Exceptional 50.3% |
| Immigrants | Uzbekistan | 98.9 /100 | #83 | Exceptional 50.3% |
| Immigrants | Hungary | 98.9 /100 | #84 | Exceptional 50.2% |
| Immigrants | Egypt | 98.9 /100 | #85 | Exceptional 50.2% |
| Immigrants | Croatia | 98.9 /100 | #86 | Exceptional 50.2% |
| Immigrants | Moldova | 98.8 /100 | #87 | Exceptional 50.2% |