Immigrants from Chile vs Haitian Master's Degree
COMPARE
Immigrants from Chile
Haitian
Master's Degree
Master's Degree Comparison
Immigrants from Chile
Haitians
16.8%
MASTER'S DEGREE
98.0/ 100
METRIC RATING
110th/ 347
METRIC RANK
12.1%
MASTER'S DEGREE
0.3/ 100
METRIC RATING
271st/ 347
METRIC RANK
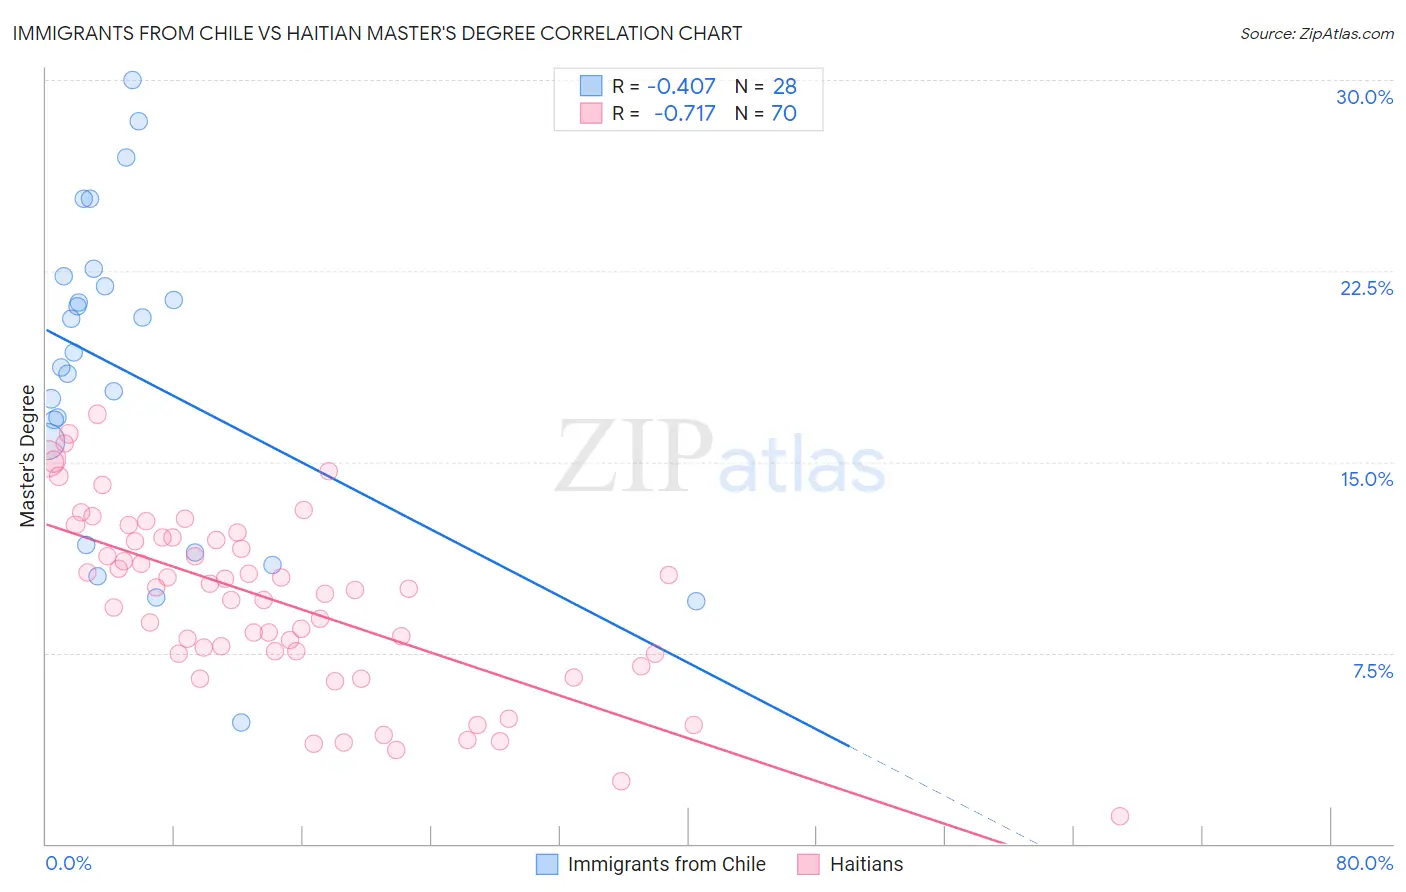
Immigrants from Chile vs Haitian Master's Degree Correlation Chart
The statistical analysis conducted on geographies consisting of 218,626,244 people shows a moderate negative correlation between the proportion of Immigrants from Chile and percentage of population with at least master's degree education in the United States with a correlation coefficient (R) of -0.407 and weighted average of 16.8%. Similarly, the statistical analysis conducted on geographies consisting of 287,849,817 people shows a strong negative correlation between the proportion of Haitians and percentage of population with at least master's degree education in the United States with a correlation coefficient (R) of -0.717 and weighted average of 12.1%, a difference of 38.6%.
Master's Degree Correlation Summary
| Measurement | Immigrants from Chile | Haitian |
| Minimum | 4.8% | 1.1% |
| Maximum | 30.0% | 16.9% |
| Range | 25.2% | 15.8% |
| Mean | 18.5% | 9.5% |
| Median | 19.0% | 10.0% |
| Interquartile 25% (IQ1) | 13.8% | 7.5% |
| Interquartile 75% (IQ3) | 22.1% | 12.0% |
| Interquartile Range (IQR) | 8.3% | 4.6% |
| Standard Deviation (Sample) | 6.2% | 3.5% |
| Standard Deviation (Population) | 6.1% | 3.5% |
Similar Demographics by Master's Degree
Demographics Similar to Immigrants from Chile by Master's Degree
In terms of master's degree, the demographic groups most similar to Immigrants from Chile are Moroccan (16.8%, a difference of 0.030%), Sierra Leonean (16.8%, a difference of 0.050%), Armenian (16.8%, a difference of 0.080%), Immigrants from Albania (16.8%, a difference of 0.17%), and Austrian (16.7%, a difference of 0.27%).
| Demographics | Rating | Rank | Master's Degree |
| Alsatians | 98.4 /100 | #103 | Exceptional 16.9% |
| Ukrainians | 98.3 /100 | #104 | Exceptional 16.9% |
| Syrians | 98.3 /100 | #105 | Exceptional 16.8% |
| Immigrants | Albania | 98.1 /100 | #106 | Exceptional 16.8% |
| Armenians | 98.0 /100 | #107 | Exceptional 16.8% |
| Sierra Leoneans | 98.0 /100 | #108 | Exceptional 16.8% |
| Moroccans | 98.0 /100 | #109 | Exceptional 16.8% |
| Immigrants | Chile | 98.0 /100 | #110 | Exceptional 16.8% |
| Austrians | 97.8 /100 | #111 | Exceptional 16.7% |
| Macedonians | 97.7 /100 | #112 | Exceptional 16.7% |
| Arabs | 97.7 /100 | #113 | Exceptional 16.7% |
| Northern Europeans | 97.6 /100 | #114 | Exceptional 16.7% |
| Immigrants | Uganda | 97.3 /100 | #115 | Exceptional 16.6% |
| Immigrants | Southern Europe | 97.2 /100 | #116 | Exceptional 16.6% |
| Immigrants | Moldova | 97.2 /100 | #117 | Exceptional 16.6% |
Demographics Similar to Haitians by Master's Degree
In terms of master's degree, the demographic groups most similar to Haitians are Comanche (12.1%, a difference of 0.060%), Blackfeet (12.1%, a difference of 0.15%), Cape Verdean (12.1%, a difference of 0.24%), Cuban (12.1%, a difference of 0.25%), and Black/African American (12.1%, a difference of 0.31%).
| Demographics | Rating | Rank | Master's Degree |
| Belizeans | 0.5 /100 | #264 | Tragic 12.4% |
| Immigrants | Fiji | 0.5 /100 | #265 | Tragic 12.4% |
| Bahamians | 0.5 /100 | #266 | Tragic 12.4% |
| Americans | 0.4 /100 | #267 | Tragic 12.3% |
| Native Hawaiians | 0.4 /100 | #268 | Tragic 12.3% |
| Central Americans | 0.3 /100 | #269 | Tragic 12.2% |
| Salvadorans | 0.3 /100 | #270 | Tragic 12.2% |
| Haitians | 0.3 /100 | #271 | Tragic 12.1% |
| Comanche | 0.3 /100 | #272 | Tragic 12.1% |
| Blackfeet | 0.3 /100 | #273 | Tragic 12.1% |
| Cape Verdeans | 0.3 /100 | #274 | Tragic 12.1% |
| Cubans | 0.3 /100 | #275 | Tragic 12.1% |
| Blacks/African Americans | 0.3 /100 | #276 | Tragic 12.1% |
| Immigrants | Caribbean | 0.3 /100 | #277 | Tragic 12.1% |
| Potawatomi | 0.3 /100 | #278 | Tragic 12.1% |