Immigrants from Central America vs Hispanic or Latino Bachelor's Degree
COMPARE
Immigrants from Central America
Hispanic or Latino
Bachelor's Degree
Bachelor's Degree Comparison
Immigrants from Central America
Hispanics or Latinos
27.5%
BACHELOR'S DEGREE
0.0/ 100
METRIC RATING
329th/ 347
METRIC RANK
29.6%
BACHELOR'S DEGREE
0.0/ 100
METRIC RATING
309th/ 347
METRIC RANK
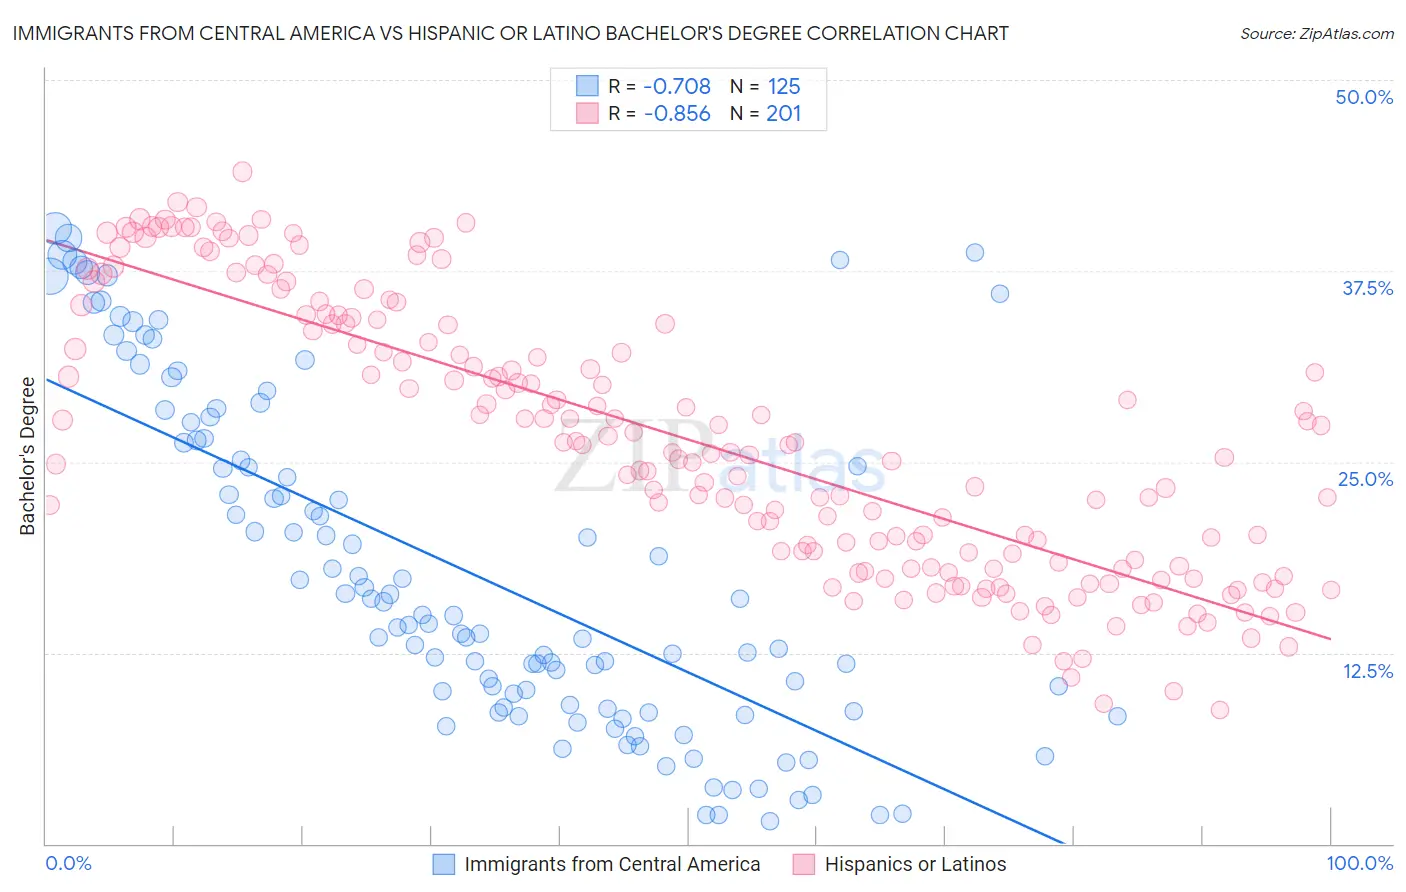
Immigrants from Central America vs Hispanic or Latino Bachelor's Degree Correlation Chart
The statistical analysis conducted on geographies consisting of 536,401,370 people shows a strong negative correlation between the proportion of Immigrants from Central America and percentage of population with at least bachelor's degree education in the United States with a correlation coefficient (R) of -0.708 and weighted average of 27.5%. Similarly, the statistical analysis conducted on geographies consisting of 578,331,176 people shows a very strong negative correlation between the proportion of Hispanics or Latinos and percentage of population with at least bachelor's degree education in the United States with a correlation coefficient (R) of -0.856 and weighted average of 29.6%, a difference of 7.7%.
Bachelor's Degree Correlation Summary
| Measurement | Immigrants from Central America | Hispanic or Latino |
| Minimum | 1.4% | 8.7% |
| Maximum | 40.3% | 44.0% |
| Range | 38.8% | 35.3% |
| Mean | 17.9% | 26.4% |
| Median | 14.9% | 25.6% |
| Interquartile 25% (IQ1) | 8.9% | 18.1% |
| Interquartile 75% (IQ3) | 26.5% | 34.1% |
| Interquartile Range (IQR) | 17.6% | 16.0% |
| Standard Deviation (Sample) | 10.9% | 8.9% |
| Standard Deviation (Population) | 10.9% | 8.9% |
Demographics Similar to Immigrants from Central America and Hispanics or Latinos by Bachelor's Degree
In terms of bachelor's degree, the demographic groups most similar to Immigrants from Central America are Crow (27.7%, a difference of 1.0%), Paiute (28.1%, a difference of 2.2%), Apache (28.3%, a difference of 2.9%), Pennsylvania German (28.4%, a difference of 3.3%), and Dutch West Indian (28.5%, a difference of 3.8%). Similarly, the demographic groups most similar to Hispanics or Latinos are Cheyenne (29.4%, a difference of 0.47%), Choctaw (29.4%, a difference of 0.54%), Seminole (29.4%, a difference of 0.60%), Alaska Native (29.4%, a difference of 0.78%), and Shoshone (29.3%, a difference of 1.1%).
| Demographics | Rating | Rank | Bachelor's Degree |
| Hispanics or Latinos | 0.0 /100 | #309 | Tragic 29.6% |
| Cheyenne | 0.0 /100 | #310 | Tragic 29.4% |
| Choctaw | 0.0 /100 | #311 | Tragic 29.4% |
| Seminole | 0.0 /100 | #312 | Tragic 29.4% |
| Alaska Natives | 0.0 /100 | #313 | Tragic 29.4% |
| Shoshone | 0.0 /100 | #314 | Tragic 29.3% |
| Immigrants | Cabo Verde | 0.0 /100 | #315 | Tragic 29.2% |
| Sioux | 0.0 /100 | #316 | Tragic 29.1% |
| Colville | 0.0 /100 | #317 | Tragic 29.0% |
| Yaqui | 0.0 /100 | #318 | Tragic 29.0% |
| Creek | 0.0 /100 | #319 | Tragic 28.9% |
| Kiowa | 0.0 /100 | #320 | Tragic 28.8% |
| Alaskan Athabascans | 0.0 /100 | #321 | Tragic 28.8% |
| Tsimshian | 0.0 /100 | #322 | Tragic 28.8% |
| Fijians | 0.0 /100 | #323 | Tragic 28.7% |
| Dutch West Indians | 0.0 /100 | #324 | Tragic 28.5% |
| Pennsylvania Germans | 0.0 /100 | #325 | Tragic 28.4% |
| Apache | 0.0 /100 | #326 | Tragic 28.3% |
| Paiute | 0.0 /100 | #327 | Tragic 28.1% |
| Crow | 0.0 /100 | #328 | Tragic 27.7% |
| Immigrants | Central America | 0.0 /100 | #329 | Tragic 27.5% |