Immigrants from Caribbean vs Immigrants from Pakistan Associate's Degree
COMPARE
Immigrants from Caribbean
Immigrants from Pakistan
Associate's Degree
Associate's Degree Comparison
Immigrants from Caribbean
Immigrants from Pakistan
39.7%
ASSOCIATE'S DEGREE
0.0/ 100
METRIC RATING
286th/ 347
METRIC RANK
50.9%
ASSOCIATE'S DEGREE
99.5/ 100
METRIC RATING
72nd/ 347
METRIC RANK
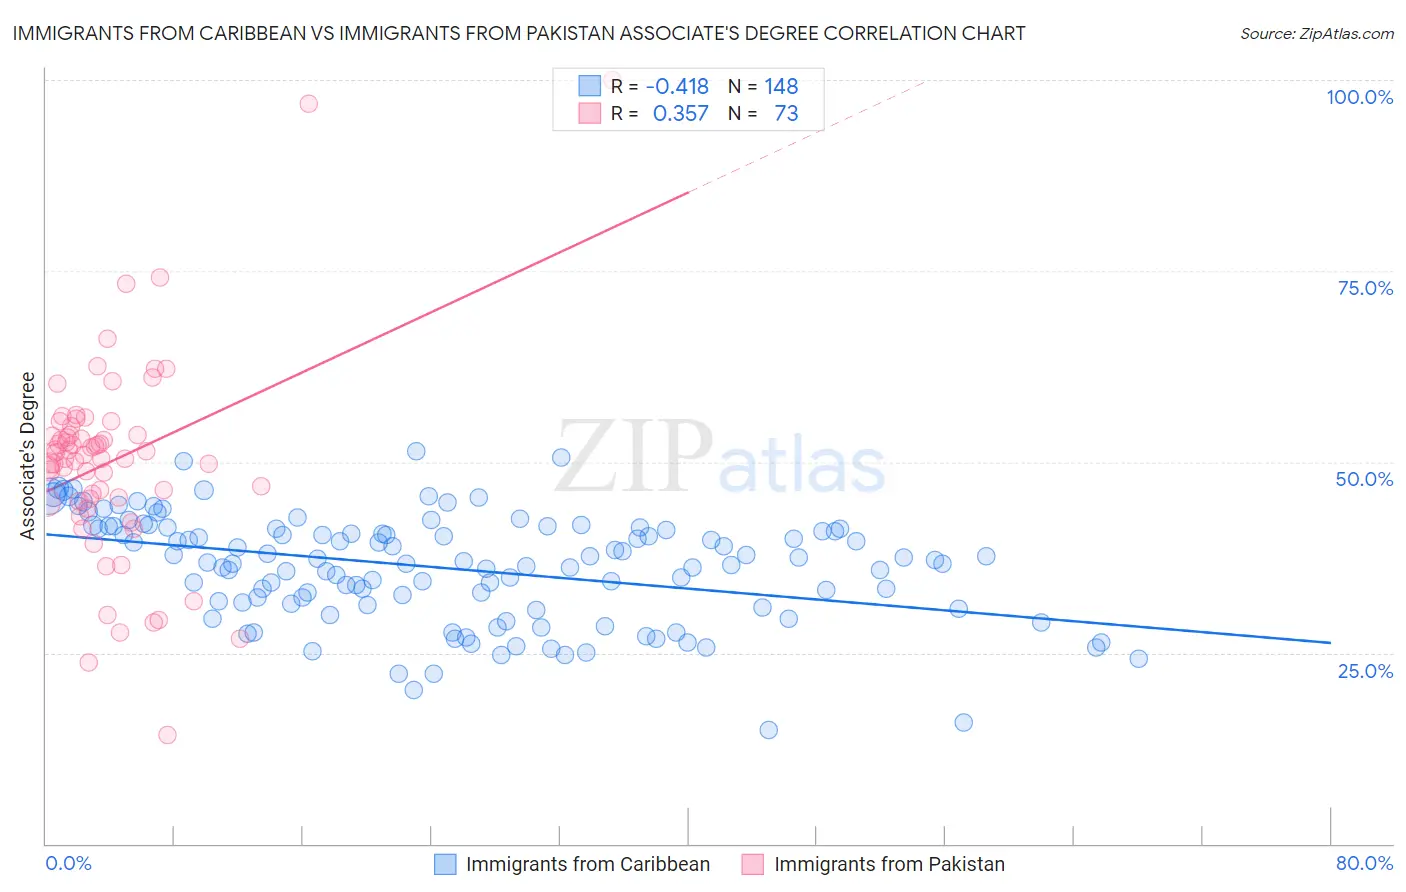
Immigrants from Caribbean vs Immigrants from Pakistan Associate's Degree Correlation Chart
The statistical analysis conducted on geographies consisting of 450,016,404 people shows a moderate negative correlation between the proportion of Immigrants from Caribbean and percentage of population with at least associate's degree education in the United States with a correlation coefficient (R) of -0.418 and weighted average of 39.7%. Similarly, the statistical analysis conducted on geographies consisting of 283,905,893 people shows a mild positive correlation between the proportion of Immigrants from Pakistan and percentage of population with at least associate's degree education in the United States with a correlation coefficient (R) of 0.357 and weighted average of 50.9%, a difference of 28.0%.
Associate's Degree Correlation Summary
| Measurement | Immigrants from Caribbean | Immigrants from Pakistan |
| Minimum | 14.8% | 14.3% |
| Maximum | 51.5% | 100.0% |
| Range | 36.6% | 85.7% |
| Mean | 36.1% | 50.1% |
| Median | 36.8% | 50.9% |
| Interquartile 25% (IQ1) | 31.3% | 45.0% |
| Interquartile 75% (IQ3) | 41.2% | 54.1% |
| Interquartile Range (IQR) | 9.9% | 9.2% |
| Standard Deviation (Sample) | 7.0% | 13.3% |
| Standard Deviation (Population) | 7.0% | 13.2% |
Similar Demographics by Associate's Degree
Demographics Similar to Immigrants from Caribbean by Associate's Degree
In terms of associate's degree, the demographic groups most similar to Immigrants from Caribbean are Aleut (39.6%, a difference of 0.26%), Immigrants from Belize (39.9%, a difference of 0.34%), Comanche (39.9%, a difference of 0.44%), Immigrants from Cuba (39.5%, a difference of 0.50%), and Haitian (40.0%, a difference of 0.55%).
| Demographics | Rating | Rank | Associate's Degree |
| Immigrants | Nicaragua | 0.1 /100 | #279 | Tragic 40.3% |
| Immigrants | Micronesia | 0.1 /100 | #280 | Tragic 40.2% |
| Immigrants | Portugal | 0.1 /100 | #281 | Tragic 40.1% |
| Bangladeshis | 0.1 /100 | #282 | Tragic 40.0% |
| Haitians | 0.1 /100 | #283 | Tragic 40.0% |
| Comanche | 0.1 /100 | #284 | Tragic 39.9% |
| Immigrants | Belize | 0.1 /100 | #285 | Tragic 39.9% |
| Immigrants | Caribbean | 0.0 /100 | #286 | Tragic 39.7% |
| Aleuts | 0.0 /100 | #287 | Tragic 39.6% |
| Immigrants | Cuba | 0.0 /100 | #288 | Tragic 39.5% |
| Central Americans | 0.0 /100 | #289 | Tragic 39.4% |
| Immigrants | Haiti | 0.0 /100 | #290 | Tragic 39.3% |
| Dominicans | 0.0 /100 | #291 | Tragic 39.3% |
| Blacks/African Americans | 0.0 /100 | #292 | Tragic 39.1% |
| Nepalese | 0.0 /100 | #293 | Tragic 39.0% |
Demographics Similar to Immigrants from Pakistan by Associate's Degree
In terms of associate's degree, the demographic groups most similar to Immigrants from Pakistan are Immigrants from Romania (50.9%, a difference of 0.060%), Immigrants from Argentina (50.9%, a difference of 0.070%), Egyptian (50.9%, a difference of 0.10%), Immigrants from Indonesia (51.0%, a difference of 0.22%), and Carpatho Rusyn (50.6%, a difference of 0.46%).
| Demographics | Rating | Rank | Associate's Degree |
| Zimbabweans | 99.7 /100 | #65 | Exceptional 51.3% |
| Immigrants | Europe | 99.7 /100 | #66 | Exceptional 51.3% |
| Argentineans | 99.6 /100 | #67 | Exceptional 51.2% |
| Immigrants | Indonesia | 99.5 /100 | #68 | Exceptional 51.0% |
| Egyptians | 99.5 /100 | #69 | Exceptional 50.9% |
| Immigrants | Argentina | 99.5 /100 | #70 | Exceptional 50.9% |
| Immigrants | Romania | 99.5 /100 | #71 | Exceptional 50.9% |
| Immigrants | Pakistan | 99.5 /100 | #72 | Exceptional 50.9% |
| Carpatho Rusyns | 99.3 /100 | #73 | Exceptional 50.6% |
| Lithuanians | 99.3 /100 | #74 | Exceptional 50.6% |
| Immigrants | Scotland | 99.3 /100 | #75 | Exceptional 50.6% |
| Immigrants | Zimbabwe | 99.2 /100 | #76 | Exceptional 50.5% |
| Immigrants | Lebanon | 99.1 /100 | #77 | Exceptional 50.5% |
| Immigrants | Eastern Europe | 99.1 /100 | #78 | Exceptional 50.5% |
| Ethiopians | 99.1 /100 | #79 | Exceptional 50.4% |