Immigrants from Caribbean vs Immigrants from Northern Europe 6th Grade

COMPARE

Immigrants from Caribbean
Race
Ancestry
AfghanAfricanAlaska NativeAlaskan AthabascanAlbanianAleutAlsatianAmericanApacheArabArapahoArgentineanArmenianAssyrian/Chaldean/SyriacAustralianAustrianBahamianBangladeshiBarbadianBasqueBelgianBelizeanBermudanBhutaneseBlackfeetBolivianBrazilianBritishBritish West IndianBulgarianBurmeseCajunCambodianCanadianCape VerdeanCarpatho RusynCelticCentral AmericanCentral American IndianCherokeeCheyenneChickasawChileanChineseChippewaChoctawColombianColvilleComancheCosta RicanCreeCreekCroatianCrowCubanCypriotCzechCzechoslovakianDanishDelawareDominicanDutchDutch West IndianEastern EuropeanEcuadorianEgyptianEnglishEstonianEthiopianEuropeanFijianFilipinoFinnishFrenchFrench American IndianFrench CanadianGermanGerman RussianGhanaianGreekGuamanian/ChamorroGuatemalanGuyaneseHaitianHmongHonduranHopiHoumaHungarianIcelanderIndian (Asian)IndonesianInupiatIranianIraqiIrishIroquoisIsraeliItalianJamaicanJapaneseJordanianKenyanKiowaKoreanLaotianLatvianLebaneseLiberianLithuanianLumbeeLuxembourgerMacedonianMalaysianMalteseMarshalleseMenomineeMexicanMexican American IndianMongolianMoroccanNative HawaiianNavajoNepaleseNew ZealanderNicaraguanNigerianNorthern EuropeanNorwegianOkinawanOsageOttawaPaiutePakistaniPalestinianPanamanianParaguayanPennsylvania GermanPeruvianPimaPolishPortuguesePotawatomiPuebloPuerto RicanPuget Sound SalishRomanianRussianSalvadoranSamoanScandinavianScotch-IrishScottishSeminoleSenegaleseSerbianShoshoneSierra LeoneanSiouxSlavicSlovakSloveneSomaliSouth AfricanSouth AmericanSouth American IndianSoviet UnionSpaniardSpanishSpanish AmericanSpanish American IndianSri LankanSubsaharan AfricanSudaneseSwedishSwissSyrianTaiwaneseThaiTlingit-HaidaTohono O'OdhamTonganTrinidadian and TobagonianTsimshianTurkishU.S. Virgin IslanderUgandanUkrainianUruguayanUteVenezuelanVietnameseWelshWest IndianYakamaYaquiYugoslavianYumanYup'ikZimbabwean
Immigration
NonimmigrantsImmigrantsAfghanistanAfricaAlbaniaArgentinaArmeniaAsiaAustraliaAustriaBahamasBangladeshBarbadosBelarusBelgiumBelizeBoliviaBosnia and HerzegovinaBrazilBulgariaBurma/MyanmarCabo VerdeCambodiaCameroonCanadaCaribbeanCentral AmericaChileChinaColombiaCongoCosta RicaCroatiaCubaCzechoslovakiaDenmarkDominicaDominican RepublicEastern AfricaEastern AsiaEastern EuropeEcuadorEgyptEl SalvadorEnglandEritreaEthiopiaEuropeFijiFranceGermanyGhanaGreeceGrenadaGuatemalaGuyanaHaitiHondurasHong KongHungaryIndiaIndonesiaIranIraqIrelandIsraelItalyJamaicaJapanJordanKazakhstanKenyaKoreaKuwaitLaosLatin AmericaLatviaLebanonLiberiaLithuaniaMalaysiaMexicoMicronesiaMiddle AfricaMoldovaMoroccoNepalNetherlandsNicaraguaNigeriaNorth AmericaNorth MacedoniaNorthern AfricaNorwayOceaniaPakistanPanamaPeruPhilippinesPolandPortugalRomaniaRussiaSaudi ArabiaScotlandSenegalSerbiaSierra LeoneSingaporeSomaliaSouth AfricaSouth AmericaSouth Central AsiaSouth Eastern AsiaSouthern EuropeSpainSri LankaSt. Vincent and the GrenadinesSudanSwedenSwitzerlandSyriaTaiwanThailandTrinidad and TobagoTurkeyUgandaUkraineUruguayUzbekistanVenezuelaVietnamWest IndiesWestern AfricaWestern AsiaWestern EuropeYemenZaireZimbabweAzores
Immigrants from Northern Europe
Race
Ancestry
AfghanAfricanAlaska NativeAlaskan AthabascanAlbanianAleutAlsatianAmericanApacheArabArapahoArgentineanArmenianAssyrian/Chaldean/SyriacAustralianAustrianBahamianBangladeshiBarbadianBasqueBelgianBelizeanBermudanBhutaneseBlackfeetBolivianBrazilianBritishBritish West IndianBulgarianBurmeseCajunCambodianCanadianCape VerdeanCarpatho RusynCelticCentral AmericanCentral American IndianCherokeeCheyenneChickasawChileanChineseChippewaChoctawColombianColvilleComancheCosta RicanCreeCreekCroatianCrowCubanCypriotCzechCzechoslovakianDanishDelawareDominicanDutchDutch West IndianEastern EuropeanEcuadorianEgyptianEnglishEstonianEthiopianEuropeanFijianFilipinoFinnishFrenchFrench American IndianFrench CanadianGermanGerman RussianGhanaianGreekGuamanian/ChamorroGuatemalanGuyaneseHaitianHmongHonduranHopiHoumaHungarianIcelanderIndian (Asian)IndonesianInupiatIranianIraqiIrishIroquoisIsraeliItalianJamaicanJapaneseJordanianKenyanKiowaKoreanLaotianLatvianLebaneseLiberianLithuanianLumbeeLuxembourgerMacedonianMalaysianMalteseMarshalleseMenomineeMexicanMexican American IndianMongolianMoroccanNative HawaiianNavajoNepaleseNew ZealanderNicaraguanNigerianNorthern EuropeanNorwegianOkinawanOsageOttawaPaiutePakistaniPalestinianPanamanianParaguayanPennsylvania GermanPeruvianPimaPolishPortuguesePotawatomiPuebloPuerto RicanPuget Sound SalishRomanianRussianSalvadoranSamoanScandinavianScotch-IrishScottishSeminoleSenegaleseSerbianShoshoneSierra LeoneanSiouxSlavicSlovakSloveneSomaliSouth AfricanSouth AmericanSouth American IndianSoviet UnionSpaniardSpanishSpanish AmericanSpanish American IndianSri LankanSubsaharan AfricanSudaneseSwedishSwissSyrianTaiwaneseThaiTlingit-HaidaTohono O'OdhamTonganTrinidadian and TobagonianTsimshianTurkishU.S. Virgin IslanderUgandanUkrainianUruguayanUteVenezuelanVietnameseWelshWest IndianYakamaYaquiYugoslavianYumanYup'ikZimbabwean
Immigration
NonimmigrantsImmigrantsAfghanistanAfricaAlbaniaArgentinaArmeniaAsiaAustraliaAustriaBahamasBangladeshBarbadosBelarusBelgiumBelizeBoliviaBosnia and HerzegovinaBrazilBulgariaBurma/MyanmarCabo VerdeCambodiaCameroonCanadaCentral AmericaChileChinaColombiaCongoCosta RicaCroatiaCubaCzechoslovakiaDenmarkDominicaDominican RepublicEastern AfricaEastern AsiaEastern EuropeEcuadorEgyptEl SalvadorEnglandEritreaEthiopiaEuropeFijiFranceGermanyGhanaGreeceGrenadaGuatemalaGuyanaHaitiHondurasHong KongHungaryIndiaIndonesiaIranIraqIrelandIsraelItalyJamaicaJapanJordanKazakhstanKenyaKoreaKuwaitLaosLatin AmericaLatviaLebanonLiberiaLithuaniaMalaysiaMexicoMicronesiaMiddle AfricaMoldovaMoroccoNepalNetherlandsNicaraguaNigeriaNorth AmericaNorth MacedoniaNorthern AfricaNorthern EuropeNorwayOceaniaPakistanPanamaPeruPhilippinesPolandPortugalRomaniaRussiaSaudi ArabiaScotlandSenegalSerbiaSierra LeoneSingaporeSomaliaSouth AfricaSouth AmericaSouth Central AsiaSouth Eastern AsiaSouthern EuropeSpainSri LankaSt. Vincent and the GrenadinesSudanSwedenSwitzerlandSyriaTaiwanThailandTrinidad and TobagoTurkeyUgandaUkraineUruguayUzbekistanVenezuelaVietnamWest IndiesWestern AfricaWestern AsiaWestern EuropeYemenZaireZimbabweAzores
6th Grade
Income
Poverty
Unemployment
Labor Participation
Family Structure
Vehicle Availability
Education Level
Disability

6th Grade Comparison

Immigrants from Caribbean

Immigrants from Northern Europe

Tragic
Exceptional
95.6%
6TH GRADE
0.0/ 100
METRIC RATING
308th/ 347
METRIC RANK
97.7%
6TH GRADE
99.6/ 100
METRIC RATING
65th/ 347
METRIC RANK

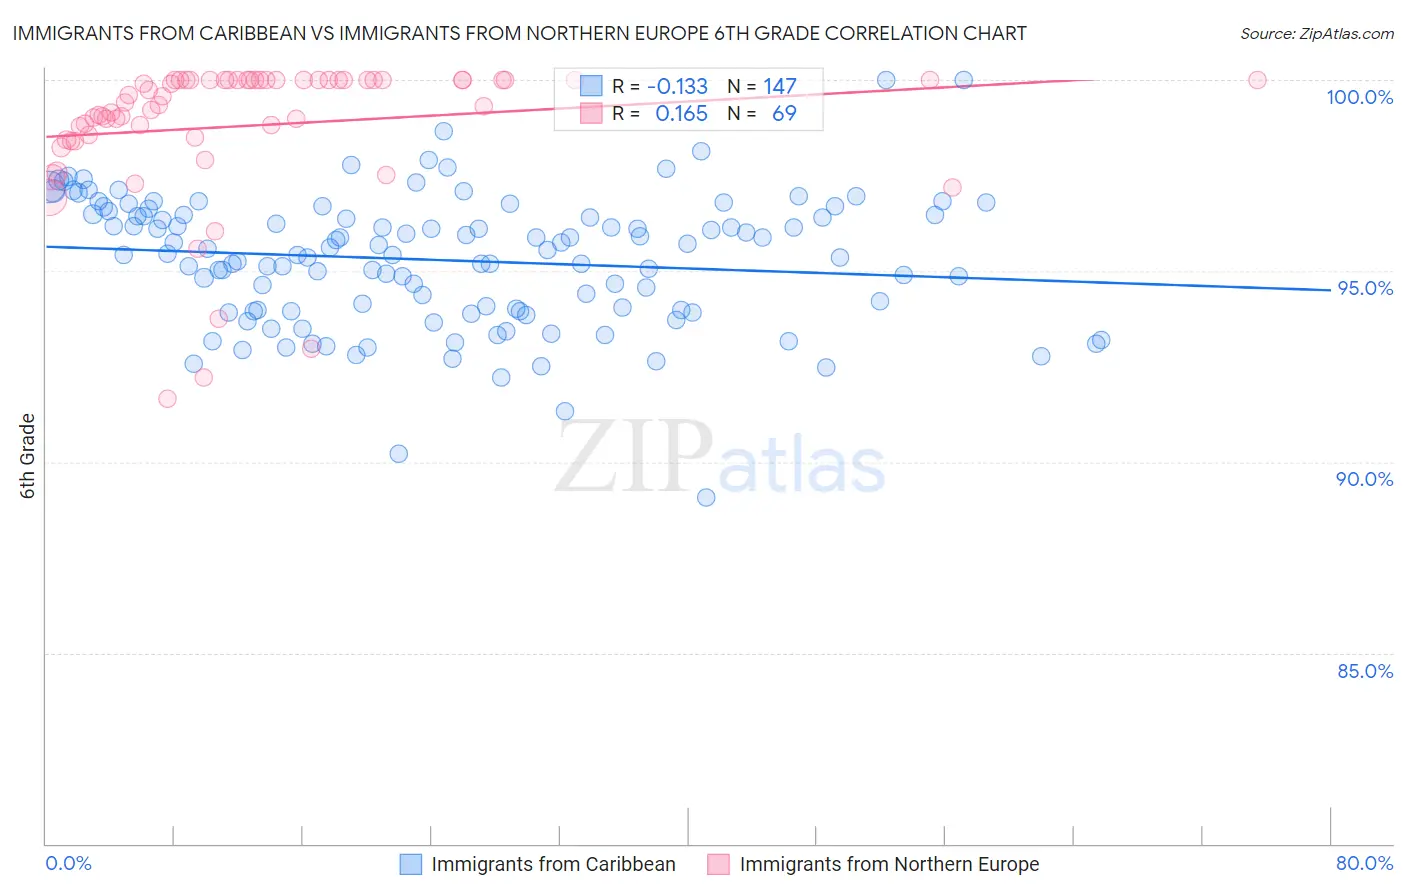
Immigrants from Caribbean vs Immigrants from Northern Europe 6th Grade Correlation Chart

The statistical analysis conducted on geographies consisting of 450,022,650 people shows a poor negative correlation between the proportion of Immigrants from Caribbean and percentage of population with at least 6th grade education in the United States with a correlation coefficient (R) of -0.133 and weighted average of 95.6%. Similarly, the statistical analysis conducted on geographies consisting of 477,226,800 people shows a poor positive correlation between the proportion of Immigrants from Northern Europe and percentage of population with at least 6th grade education in the United States with a correlation coefficient (R) of 0.165 and weighted average of 97.7%, a difference of 2.2%.
Immigrants from Caribbean vs Immigrants from Northern Europe 6th Grade

6th Grade Correlation Summary

MeasurementImmigrants from CaribbeanImmigrants from Northern Europe
Minimum89.1%91.7%
Maximum100.0%100.0%
Range10.9%8.3%
Mean95.3%98.8%
Median95.4%99.4%
Interquartile 25% (IQ1)94.0%98.5%
Interquartile 75% (IQ3)96.5%100.0%
Interquartile Range (IQR)2.5%1.5%
Standard Deviation (Sample)1.7%1.9%
Standard Deviation (Population)1.7%1.8%

Similar Demographics by 6th Grade

Demographics Similar to Immigrants from Caribbean by 6th Grade

In terms of 6th grade, the demographic groups most similar to Immigrants from Caribbean are Guyanese (95.6%, a difference of 0.010%), Immigrants from Haiti (95.6%, a difference of 0.030%), Puerto Rican (95.5%, a difference of 0.050%), Ecuadorian (95.5%, a difference of 0.060%), and Immigrants from Cuba (95.6%, a difference of 0.070%).
DemographicsRating | Rank6th Grade
Immigrants | Immigrants
0.0
/100
|
#301
Tragic
95.7%
Immigrants | Burma/Myanmar
0.0
/100
|
#302
Tragic
95.7%
Bangladeshis
0.0
/100
|
#303
Tragic
95.7%
Indonesians
0.0
/100
|
#304
Tragic
95.6%
Immigrants | Cuba
0.0
/100
|
#305
Tragic
95.6%
Immigrants | Haiti
0.0
/100
|
#306
Tragic
95.6%
Guyanese
0.0
/100
|
#307
Tragic
95.6%
Immigrants | Caribbean
0.0
/100
|
#308
Tragic
95.6%
Puerto Ricans
0.0
/100
|
#309
Tragic
95.5%
Ecuadorians
0.0
/100
|
#310
Tragic
95.5%
Immigrants | Portugal
0.0
/100
|
#311
Tragic
95.5%
Immigrants | Guyana
0.0
/100
|
#312
Tragic
95.5%
Nicaraguans
0.0
/100
|
#313
Tragic
95.4%
Immigrants | Vietnam
0.0
/100
|
#314
Tragic
95.4%
Immigrants | Bangladesh
0.0
/100
|
#315
Tragic
95.4%

Demographics Similar to Immigrants from Northern Europe by 6th Grade

In terms of 6th grade, the demographic groups most similar to Immigrants from Northern Europe are New Zealander (97.7%, a difference of 0.0%), Canadian (97.7%, a difference of 0.010%), Kiowa (97.7%, a difference of 0.010%), Immigrants from Austria (97.7%, a difference of 0.010%), and Russian (97.7%, a difference of 0.020%).
DemographicsRating | Rank6th Grade
Greeks
99.8
/100
|
#58
Exceptional
97.7%
Americans
99.8
/100
|
#59
Exceptional
97.7%
Immigrants | Canada
99.8
/100
|
#60
Exceptional
97.7%
Serbians
99.7
/100
|
#61
Exceptional
97.7%
Immigrants | North America
99.7
/100
|
#62
Exceptional
97.7%
Russians
99.7
/100
|
#63
Exceptional
97.7%
Canadians
99.7
/100
|
#64
Exceptional
97.7%
Immigrants | Northern Europe
99.6
/100
|
#65
Exceptional
97.7%
New Zealanders
99.6
/100
|
#66
Exceptional
97.7%
Kiowa
99.6
/100
|
#67
Exceptional
97.7%
Immigrants | Austria
99.6
/100
|
#68
Exceptional
97.7%
Iranians
99.6
/100
|
#69
Exceptional
97.6%
Cajuns
99.5
/100
|
#70
Exceptional
97.6%
Chickasaw
99.5
/100
|
#71
Exceptional
97.6%
Macedonians
99.4
/100
|
#72
Exceptional
97.6%