Immigrants from Caribbean vs Immigrants from Nicaragua High School Diploma
COMPARE
Immigrants from Caribbean
Immigrants from Nicaragua
High School Diploma
High School Diploma Comparison
Immigrants from Caribbean
Immigrants from Nicaragua
84.3%
HIGH SCHOOL DIPLOMA
0.0/ 100
METRIC RATING
317th/ 347
METRIC RANK
83.1%
HIGH SCHOOL DIPLOMA
0.0/ 100
METRIC RATING
325th/ 347
METRIC RANK
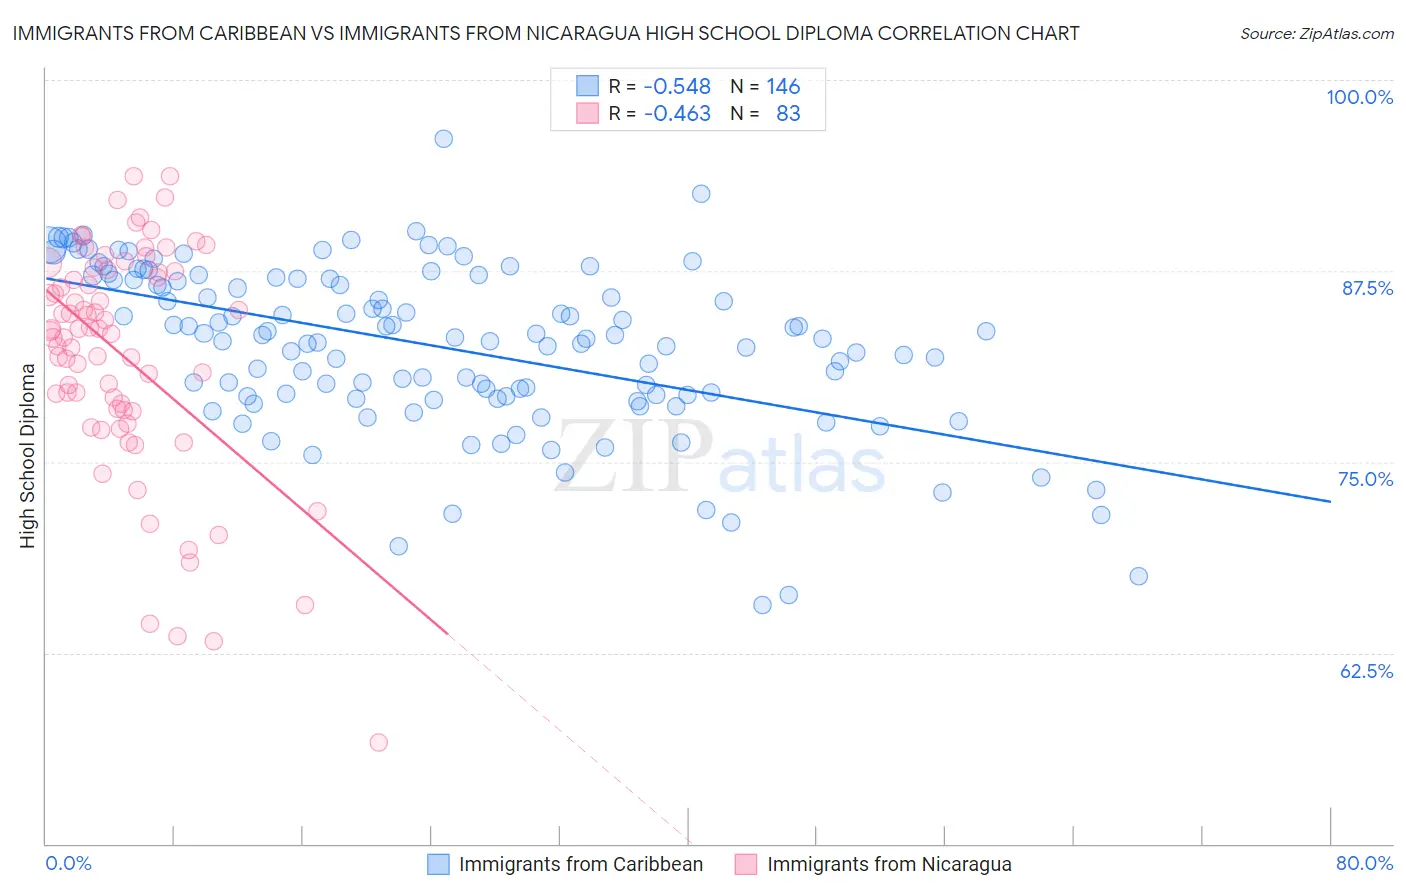
Immigrants from Caribbean vs Immigrants from Nicaragua High School Diploma Correlation Chart
The statistical analysis conducted on geographies consisting of 450,064,503 people shows a substantial negative correlation between the proportion of Immigrants from Caribbean and percentage of population with at least high school diploma education in the United States with a correlation coefficient (R) of -0.548 and weighted average of 84.3%. Similarly, the statistical analysis conducted on geographies consisting of 236,340,156 people shows a moderate negative correlation between the proportion of Immigrants from Nicaragua and percentage of population with at least high school diploma education in the United States with a correlation coefficient (R) of -0.463 and weighted average of 83.1%, a difference of 1.4%.
High School Diploma Correlation Summary
| Measurement | Immigrants from Caribbean | Immigrants from Nicaragua |
| Minimum | 65.6% | 56.7% |
| Maximum | 96.2% | 93.7% |
| Range | 30.5% | 37.0% |
| Mean | 82.5% | 81.9% |
| Median | 83.1% | 83.6% |
| Interquartile 25% (IQ1) | 79.3% | 78.4% |
| Interquartile 75% (IQ3) | 87.0% | 87.5% |
| Interquartile Range (IQR) | 7.7% | 9.1% |
| Standard Deviation (Sample) | 5.4% | 7.5% |
| Standard Deviation (Population) | 5.4% | 7.5% |
Demographics Similar to Immigrants from Caribbean and Immigrants from Nicaragua by High School Diploma
In terms of high school diploma, the demographic groups most similar to Immigrants from Caribbean are Belizean (84.3%, a difference of 0.060%), Immigrants from Belize (84.2%, a difference of 0.070%), Central American Indian (84.2%, a difference of 0.11%), Nicaraguan (84.1%, a difference of 0.21%), and Yuman (84.0%, a difference of 0.34%). Similarly, the demographic groups most similar to Immigrants from Nicaragua are Mexican American Indian (83.0%, a difference of 0.070%), Honduran (83.0%, a difference of 0.11%), Dominican (82.9%, a difference of 0.16%), Immigrants from Cabo Verde (83.3%, a difference of 0.23%), and Hispanic or Latino (82.9%, a difference of 0.26%).
| Demographics | Rating | Rank | High School Diploma |
| Ecuadorians | 0.0 /100 | #311 | Tragic 85.1% |
| Cape Verdeans | 0.0 /100 | #312 | Tragic 85.1% |
| Immigrants | Ecuador | 0.0 /100 | #313 | Tragic 84.8% |
| Yaqui | 0.0 /100 | #314 | Tragic 84.7% |
| Puerto Ricans | 0.0 /100 | #315 | Tragic 84.7% |
| Belizeans | 0.0 /100 | #316 | Tragic 84.3% |
| Immigrants | Caribbean | 0.0 /100 | #317 | Tragic 84.3% |
| Immigrants | Belize | 0.0 /100 | #318 | Tragic 84.2% |
| Central American Indians | 0.0 /100 | #319 | Tragic 84.2% |
| Nicaraguans | 0.0 /100 | #320 | Tragic 84.1% |
| Yuman | 0.0 /100 | #321 | Tragic 84.0% |
| Lumbee | 0.0 /100 | #322 | Tragic 83.6% |
| Immigrants | Cuba | 0.0 /100 | #323 | Tragic 83.5% |
| Immigrants | Cabo Verde | 0.0 /100 | #324 | Tragic 83.3% |
| Immigrants | Nicaragua | 0.0 /100 | #325 | Tragic 83.1% |
| Mexican American Indians | 0.0 /100 | #326 | Tragic 83.0% |
| Hondurans | 0.0 /100 | #327 | Tragic 83.0% |
| Dominicans | 0.0 /100 | #328 | Tragic 82.9% |
| Hispanics or Latinos | 0.0 /100 | #329 | Tragic 82.9% |
| Immigrants | Azores | 0.0 /100 | #330 | Tragic 82.8% |
| Central Americans | 0.0 /100 | #331 | Tragic 82.5% |