Immigrants from Canada vs Delaware 3rd Grade

COMPARE

Immigrants from Canada
Race
Ancestry
AfghanAfricanAlaska NativeAlaskan AthabascanAlbanianAleutAlsatianAmericanApacheArabArapahoArgentineanArmenianAssyrian/Chaldean/SyriacAustralianAustrianBahamianBangladeshiBarbadianBasqueBelgianBelizeanBermudanBhutaneseBlackfeetBolivianBrazilianBritishBritish West IndianBulgarianBurmeseCajunCambodianCanadianCape VerdeanCarpatho RusynCelticCentral AmericanCentral American IndianCherokeeCheyenneChickasawChileanChineseChippewaChoctawColombianColvilleComancheCosta RicanCreeCreekCroatianCrowCubanCypriotCzechCzechoslovakianDanishDominicanDutchDutch West IndianEastern EuropeanEcuadorianEgyptianEnglishEstonianEthiopianEuropeanFijianFilipinoFinnishFrenchFrench American IndianFrench CanadianGermanGerman RussianGhanaianGreekGuamanian/ChamorroGuatemalanGuyaneseHaitianHmongHonduranHopiHoumaHungarianIcelanderIndian (Asian)IndonesianInupiatIranianIraqiIrishIroquoisIsraeliItalianJamaicanJapaneseJordanianKenyanKiowaKoreanLaotianLatvianLebaneseLiberianLithuanianLumbeeLuxembourgerMacedonianMalaysianMalteseMarshalleseMenomineeMexicanMexican American IndianMongolianMoroccanNative HawaiianNavajoNepaleseNew ZealanderNicaraguanNigerianNorthern EuropeanNorwegianOkinawanOsageOttawaPaiutePakistaniPalestinianPanamanianParaguayanPennsylvania GermanPeruvianPimaPolishPortuguesePotawatomiPuebloPuerto RicanPuget Sound SalishRomanianRussianSalvadoranSamoanScandinavianScotch-IrishScottishSeminoleSenegaleseSerbianShoshoneSierra LeoneanSiouxSlavicSlovakSloveneSomaliSouth AfricanSouth AmericanSouth American IndianSoviet UnionSpaniardSpanishSpanish AmericanSpanish American IndianSri LankanSubsaharan AfricanSudaneseSwedishSwissSyrianTaiwaneseThaiTlingit-HaidaTohono O'OdhamTonganTrinidadian and TobagonianTsimshianTurkishU.S. Virgin IslanderUgandanUkrainianUruguayanUteVenezuelanVietnameseWelshWest IndianYakamaYaquiYugoslavianYumanYup'ikZimbabwean
Immigration
NonimmigrantsImmigrantsAfghanistanAfricaAlbaniaArgentinaArmeniaAsiaAustraliaAustriaBahamasBangladeshBarbadosBelarusBelgiumBelizeBoliviaBosnia and HerzegovinaBrazilBulgariaBurma/MyanmarCabo VerdeCambodiaCameroonCanadaCaribbeanCentral AmericaChileChinaColombiaCongoCosta RicaCroatiaCubaCzechoslovakiaDenmarkDominicaDominican RepublicEastern AfricaEastern AsiaEastern EuropeEcuadorEgyptEl SalvadorEnglandEritreaEthiopiaEuropeFijiFranceGermanyGhanaGreeceGrenadaGuatemalaGuyanaHaitiHondurasHong KongHungaryIndiaIndonesiaIranIraqIrelandIsraelItalyJamaicaJapanJordanKazakhstanKenyaKoreaKuwaitLaosLatin AmericaLatviaLebanonLiberiaLithuaniaMalaysiaMexicoMicronesiaMiddle AfricaMoldovaMoroccoNepalNetherlandsNicaraguaNigeriaNorth AmericaNorth MacedoniaNorthern AfricaNorthern EuropeNorwayOceaniaPakistanPanamaPeruPhilippinesPolandPortugalRomaniaRussiaSaudi ArabiaScotlandSenegalSerbiaSierra LeoneSingaporeSomaliaSouth AfricaSouth AmericaSouth Central AsiaSouth Eastern AsiaSouthern EuropeSpainSri LankaSt. Vincent and the GrenadinesSudanSwedenSwitzerlandSyriaTaiwanThailandTrinidad and TobagoTurkeyUgandaUkraineUruguayUzbekistanVenezuelaVietnamWest IndiesWestern AfricaWestern AsiaWestern EuropeYemenZaireZimbabweAzores
Delaware
Race
Ancestry
AfghanAfricanAlaska NativeAlaskan AthabascanAlbanianAleutAlsatianAmericanApacheArabArapahoArgentineanArmenianAssyrian/Chaldean/SyriacAustralianAustrianBahamianBangladeshiBarbadianBasqueBelgianBelizeanBermudanBhutaneseBlackfeetBolivianBrazilianBritishBritish West IndianBulgarianBurmeseCajunCambodianCanadianCape VerdeanCarpatho RusynCelticCentral AmericanCentral American IndianCherokeeCheyenneChickasawChileanChineseChippewaChoctawColombianColvilleComancheCosta RicanCreeCreekCroatianCrowCubanCypriotCzechCzechoslovakianDanishDelawareDominicanDutchDutch West IndianEastern EuropeanEcuadorianEgyptianEnglishEstonianEthiopianEuropeanFijianFilipinoFinnishFrenchFrench American IndianFrench CanadianGermanGerman RussianGhanaianGreekGuamanian/ChamorroGuatemalanGuyaneseHaitianHmongHonduranHopiHoumaHungarianIcelanderIndian (Asian)IndonesianInupiatIranianIraqiIrishIroquoisIsraeliItalianJamaicanJapaneseJordanianKenyanKiowaKoreanLaotianLatvianLebaneseLiberianLithuanianLumbeeLuxembourgerMacedonianMalaysianMalteseMarshalleseMenomineeMexicanMexican American IndianMongolianMoroccanNative HawaiianNavajoNepaleseNew ZealanderNicaraguanNigerianNorthern EuropeanNorwegianOkinawanOsageOttawaPaiutePakistaniPalestinianPanamanianParaguayanPennsylvania GermanPeruvianPimaPolishPortuguesePotawatomiPuebloPuerto RicanPuget Sound SalishRomanianRussianSalvadoranSamoanScandinavianScotch-IrishScottishSeminoleSenegaleseSerbianShoshoneSierra LeoneanSiouxSlavicSlovakSloveneSomaliSouth AfricanSouth AmericanSouth American IndianSoviet UnionSpaniardSpanishSpanish AmericanSpanish American IndianSri LankanSubsaharan AfricanSudaneseSwedishSwissSyrianTaiwaneseThaiTlingit-HaidaTohono O'OdhamTonganTrinidadian and TobagonianTsimshianTurkishU.S. Virgin IslanderUgandanUkrainianUruguayanUteVenezuelanVietnameseWelshWest IndianYakamaYaquiYugoslavianYumanYup'ikZimbabwean
Immigration
NonimmigrantsImmigrantsAfghanistanAfricaAlbaniaArgentinaArmeniaAsiaAustraliaAustriaBahamasBangladeshBarbadosBelarusBelgiumBelizeBoliviaBosnia and HerzegovinaBrazilBulgariaBurma/MyanmarCabo VerdeCambodiaCameroonCaribbeanCentral AmericaChileChinaColombiaCongoCosta RicaCroatiaCubaCzechoslovakiaDenmarkDominicaDominican RepublicEastern AfricaEastern AsiaEastern EuropeEcuadorEgyptEl SalvadorEnglandEritreaEthiopiaEuropeFijiFranceGermanyGhanaGreeceGrenadaGuatemalaGuyanaHaitiHondurasHong KongHungaryIndiaIndonesiaIranIraqIrelandIsraelItalyJamaicaJapanJordanKazakhstanKenyaKoreaKuwaitLaosLatin AmericaLatviaLebanonLiberiaLithuaniaMalaysiaMexicoMicronesiaMiddle AfricaMoldovaMoroccoNepalNetherlandsNicaraguaNigeriaNorth AmericaNorth MacedoniaNorthern AfricaNorthern EuropeNorwayOceaniaPakistanPanamaPeruPhilippinesPolandPortugalRomaniaRussiaSaudi ArabiaScotlandSenegalSerbiaSierra LeoneSingaporeSomaliaSouth AfricaSouth AmericaSouth Central AsiaSouth Eastern AsiaSouthern EuropeSpainSri LankaSt. Vincent and the GrenadinesSudanSwedenSwitzerlandSyriaTaiwanThailandTrinidad and TobagoTurkeyUgandaUkraineUruguayUzbekistanVenezuelaVietnamWest IndiesWestern AfricaWestern AsiaWestern EuropeYemenZaireZimbabweAzores
3rd Grade
Income
Poverty
Unemployment
Labor Participation
Family Structure
Vehicle Availability
Education Level
Disability

3rd Grade Comparison

Immigrants from Canada

Delaware

Exceptional
Exceptional
98.2%
3RD GRADE
99.7/ 100
METRIC RATING
62nd/ 347
METRIC RANK
98.1%
3RD GRADE
98.8/ 100
METRIC RATING
89th/ 347
METRIC RANK

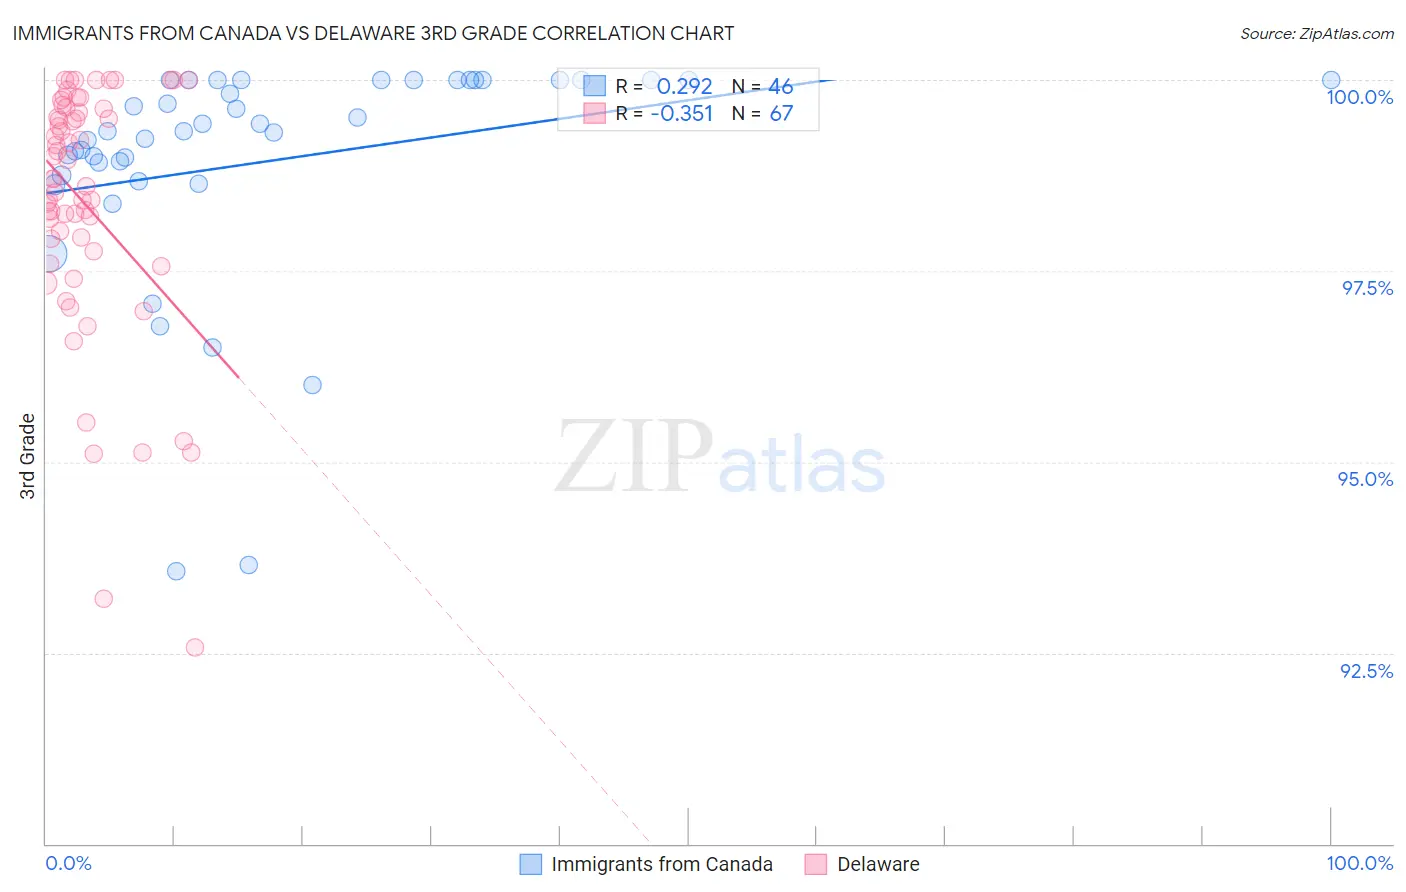
Immigrants from Canada vs Delaware 3rd Grade Correlation Chart

The statistical analysis conducted on geographies consisting of 459,397,554 people shows a weak positive correlation between the proportion of Immigrants from Canada and percentage of population with at least 3rd grade education in the United States with a correlation coefficient (R) of 0.292 and weighted average of 98.2%. Similarly, the statistical analysis conducted on geographies consisting of 96,235,191 people shows a mild negative correlation between the proportion of Delaware and percentage of population with at least 3rd grade education in the United States with a correlation coefficient (R) of -0.351 and weighted average of 98.1%, a difference of 0.12%.
Immigrants from Canada vs Delaware 3rd Grade

3rd Grade Correlation Summary

MeasurementImmigrants from CanadaDelaware
Minimum93.6%92.6%
Maximum100.0%100.0%
Range6.4%7.4%
Mean98.9%98.4%
Median99.3%98.7%
Interquartile 25% (IQ1)98.8%97.8%
Interquartile 75% (IQ3)100.0%99.6%
Interquartile Range (IQR)1.2%1.9%
Standard Deviation (Sample)1.5%1.6%
Standard Deviation (Population)1.5%1.6%

Similar Demographics by 3rd Grade

Demographics Similar to Immigrants from Canada by 3rd Grade

In terms of 3rd grade, the demographic groups most similar to Immigrants from Canada are Pueblo (98.2%, a difference of 0.0%), Austrian (98.3%, a difference of 0.010%), Slavic (98.3%, a difference of 0.010%), Greek (98.3%, a difference of 0.010%), and Maltese (98.3%, a difference of 0.010%).
DemographicsRating | Rank3rd Grade
Americans
99.8
/100
|
#55
Exceptional
98.3%
Austrians
99.8
/100
|
#56
Exceptional
98.3%
Slavs
99.7
/100
|
#57
Exceptional
98.3%
Greeks
99.7
/100
|
#58
Exceptional
98.3%
Maltese
99.7
/100
|
#59
Exceptional
98.3%
Creek
99.7
/100
|
#60
Exceptional
98.2%
Pueblo
99.7
/100
|
#61
Exceptional
98.2%
Immigrants | Canada
99.7
/100
|
#62
Exceptional
98.2%
Immigrants | North America
99.7
/100
|
#63
Exceptional
98.2%
Kiowa
99.6
/100
|
#64
Exceptional
98.2%
New Zealanders
99.6
/100
|
#65
Exceptional
98.2%
Serbians
99.6
/100
|
#66
Exceptional
98.2%
Russians
99.6
/100
|
#67
Exceptional
98.2%
Immigrants | Northern Europe
99.6
/100
|
#68
Exceptional
98.2%
Canadians
99.6
/100
|
#69
Exceptional
98.2%

Demographics Similar to Delaware by 3rd Grade

In terms of 3rd grade, the demographic groups most similar to Delaware are Immigrants from Australia (98.1%, a difference of 0.0%), Potawatomi (98.1%, a difference of 0.0%), Immigrants from Denmark (98.1%, a difference of 0.0%), Immigrants from India (98.1%, a difference of 0.0%), and Zimbabwean (98.1%, a difference of 0.0%).
DemographicsRating | Rank3rd Grade
Shoshone
99.0
/100
|
#82
Exceptional
98.1%
Ukrainians
98.9
/100
|
#83
Exceptional
98.1%
Immigrants | Sweden
98.9
/100
|
#84
Exceptional
98.1%
Immigrants | Australia
98.9
/100
|
#85
Exceptional
98.1%
Potawatomi
98.9
/100
|
#86
Exceptional
98.1%
Immigrants | Denmark
98.8
/100
|
#87
Exceptional
98.1%
Immigrants | India
98.8
/100
|
#88
Exceptional
98.1%
Delaware
98.8
/100
|
#89
Exceptional
98.1%
Zimbabweans
98.8
/100
|
#90
Exceptional
98.1%
Hopi
98.7
/100
|
#91
Exceptional
98.1%
Immigrants | South Africa
98.7
/100
|
#92
Exceptional
98.1%
Immigrants | Western Europe
98.7
/100
|
#93
Exceptional
98.1%
Immigrants | Germany
98.4
/100
|
#94
Exceptional
98.1%
Cypriots
98.4
/100
|
#95
Exceptional
98.1%
Immigrants | Ireland
98.2
/100
|
#96
Exceptional
98.1%