Immigrants from Cambodia vs Immigrants from Portugal 12th Grade, No Diploma
COMPARE
Immigrants from Cambodia
Immigrants from Portugal
12th Grade, No Diploma
12th Grade, No Diploma Comparison
Immigrants from Cambodia
Immigrants from Portugal
88.1%
12TH GRADE, NO DIPLOMA
0.0/ 100
METRIC RATING
301st/ 347
METRIC RANK
87.6%
12TH GRADE, NO DIPLOMA
0.0/ 100
METRIC RATING
307th/ 347
METRIC RANK
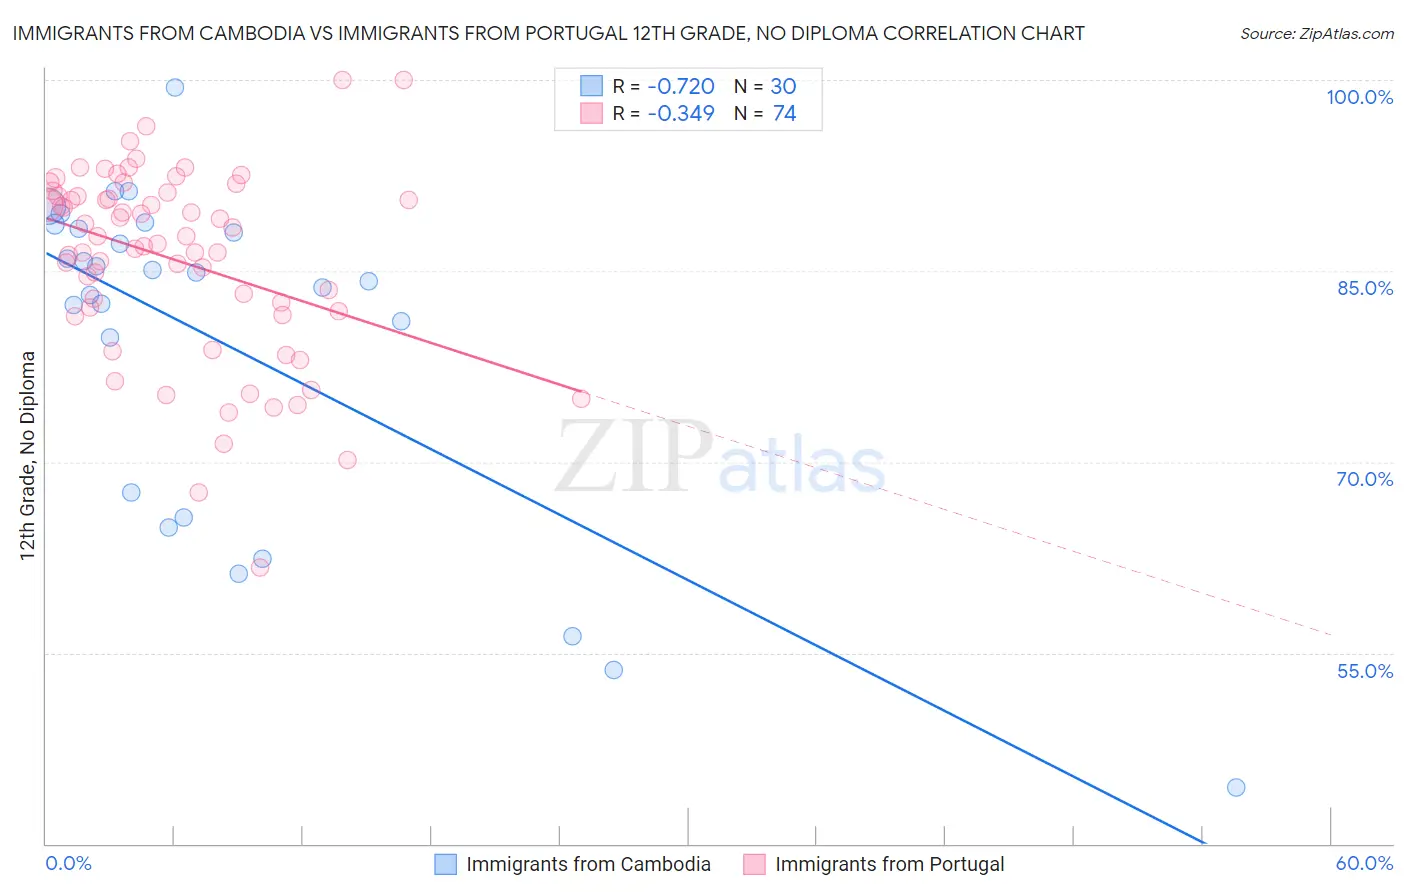
Immigrants from Cambodia vs Immigrants from Portugal 12th Grade, No Diploma Correlation Chart
The statistical analysis conducted on geographies consisting of 205,153,442 people shows a strong negative correlation between the proportion of Immigrants from Cambodia and percentage of population with at least 12th grade (no diploma) education in the United States with a correlation coefficient (R) of -0.720 and weighted average of 88.1%. Similarly, the statistical analysis conducted on geographies consisting of 174,792,669 people shows a mild negative correlation between the proportion of Immigrants from Portugal and percentage of population with at least 12th grade (no diploma) education in the United States with a correlation coefficient (R) of -0.349 and weighted average of 87.6%, a difference of 0.50%.
12th Grade, No Diploma Correlation Summary
| Measurement | Immigrants from Cambodia | Immigrants from Portugal |
| Minimum | 44.4% | 61.7% |
| Maximum | 99.4% | 100.0% |
| Range | 54.9% | 38.3% |
| Mean | 79.4% | 85.8% |
| Median | 84.6% | 87.4% |
| Interquartile 25% (IQ1) | 67.6% | 81.8% |
| Interquartile 75% (IQ3) | 88.3% | 90.9% |
| Interquartile Range (IQR) | 20.8% | 9.1% |
| Standard Deviation (Sample) | 13.3% | 7.5% |
| Standard Deviation (Population) | 13.1% | 7.5% |
Demographics Similar to Immigrants from Cambodia and Immigrants from Portugal by 12th Grade, No Diploma
In terms of 12th grade, no diploma, the demographic groups most similar to Immigrants from Cambodia are Immigrants from Guyana (88.1%, a difference of 0.0%), Ecuadorian (88.0%, a difference of 0.030%), Nepalese (88.1%, a difference of 0.050%), Immigrants from Haiti (88.2%, a difference of 0.090%), and Immigrants from Bangladesh (88.0%, a difference of 0.13%). Similarly, the demographic groups most similar to Immigrants from Portugal are Native/Alaskan (87.7%, a difference of 0.040%), Yup'ik (87.6%, a difference of 0.040%), Immigrants from Armenia (87.6%, a difference of 0.070%), Immigrants from Dominica (87.7%, a difference of 0.11%), and Immigrants from Cuba (87.5%, a difference of 0.12%).
| Demographics | Rating | Rank | 12th Grade, No Diploma |
| Guyanese | 0.0 /100 | #294 | Tragic 88.3% |
| Immigrants | Immigrants | 0.0 /100 | #295 | Tragic 88.2% |
| Fijians | 0.0 /100 | #296 | Tragic 88.2% |
| Pueblo | 0.0 /100 | #297 | Tragic 88.2% |
| Immigrants | Haiti | 0.0 /100 | #298 | Tragic 88.2% |
| Nepalese | 0.0 /100 | #299 | Tragic 88.1% |
| Immigrants | Guyana | 0.0 /100 | #300 | Tragic 88.1% |
| Immigrants | Cambodia | 0.0 /100 | #301 | Tragic 88.1% |
| Ecuadorians | 0.0 /100 | #302 | Tragic 88.0% |
| Immigrants | Bangladesh | 0.0 /100 | #303 | Tragic 88.0% |
| Vietnamese | 0.0 /100 | #304 | Tragic 87.9% |
| Immigrants | Dominica | 0.0 /100 | #305 | Tragic 87.7% |
| Natives/Alaskans | 0.0 /100 | #306 | Tragic 87.7% |
| Immigrants | Portugal | 0.0 /100 | #307 | Tragic 87.6% |
| Yup'ik | 0.0 /100 | #308 | Tragic 87.6% |
| Immigrants | Armenia | 0.0 /100 | #309 | Tragic 87.6% |
| Immigrants | Cuba | 0.0 /100 | #310 | Tragic 87.5% |
| Yaqui | 0.0 /100 | #311 | Tragic 87.5% |
| Immigrants | Ecuador | 0.0 /100 | #312 | Tragic 87.5% |
| Immigrants | Caribbean | 0.0 /100 | #313 | Tragic 87.4% |
| Cape Verdeans | 0.0 /100 | #314 | Tragic 87.4% |