Immigrants from Cambodia vs Arab 1st Grade
COMPARE
Immigrants from Cambodia
Arab
1st Grade
1st Grade Comparison
Immigrants from Cambodia
Arabs
96.5%
1ST GRADE
0.0/ 100
METRIC RATING
337th/ 347
METRIC RANK
97.9%
1ST GRADE
35.5/ 100
METRIC RATING
188th/ 347
METRIC RANK
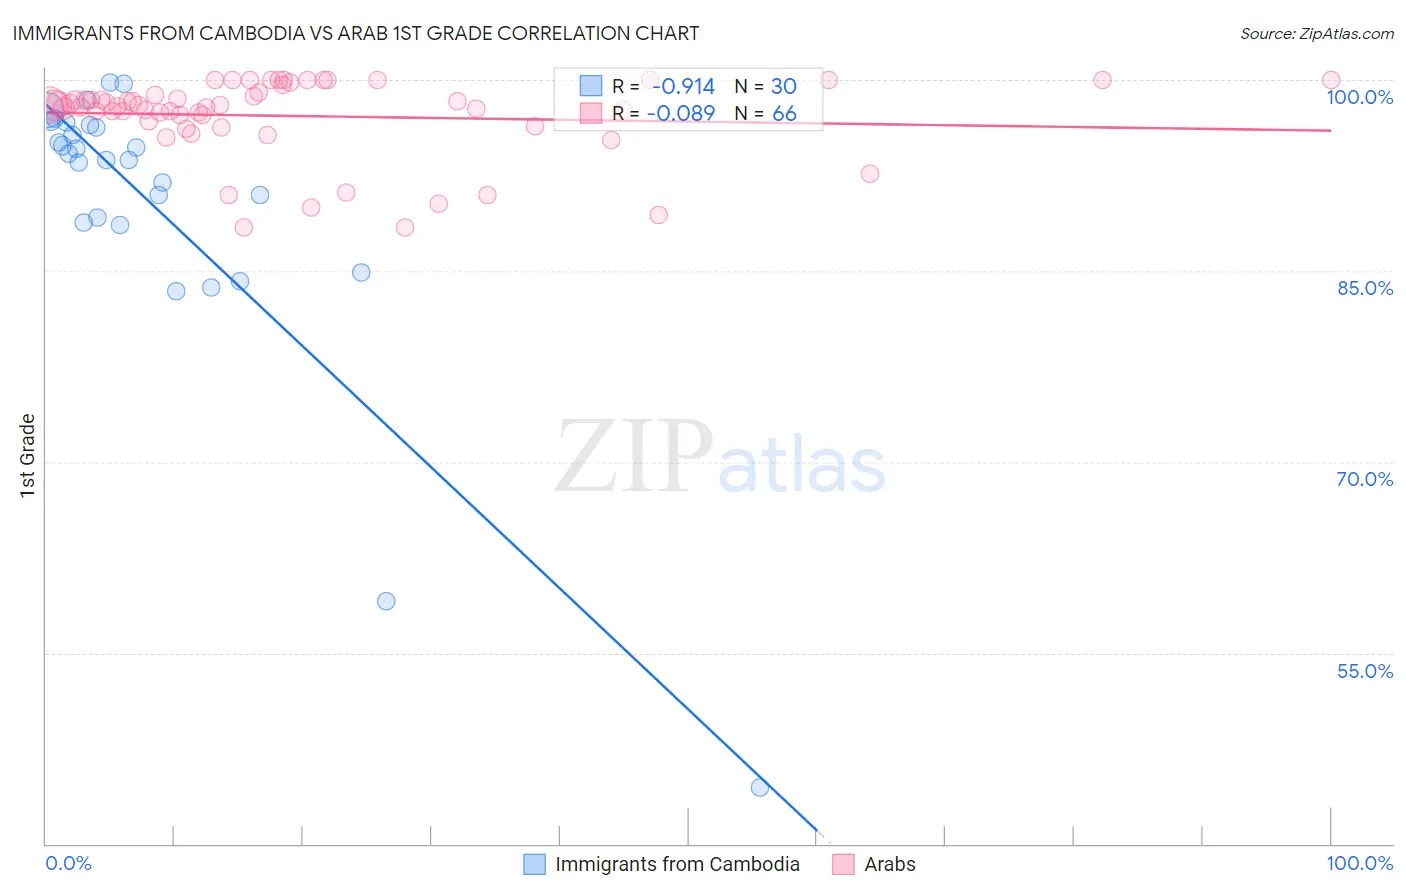
Immigrants from Cambodia vs Arab 1st Grade Correlation Chart
The statistical analysis conducted on geographies consisting of 205,153,442 people shows a near-perfect negative correlation between the proportion of Immigrants from Cambodia and percentage of population with at least 1st grade education in the United States with a correlation coefficient (R) of -0.914 and weighted average of 96.5%. Similarly, the statistical analysis conducted on geographies consisting of 486,872,222 people shows a slight negative correlation between the proportion of Arabs and percentage of population with at least 1st grade education in the United States with a correlation coefficient (R) of -0.089 and weighted average of 97.9%, a difference of 1.5%.
1st Grade Correlation Summary
| Measurement | Immigrants from Cambodia | Arab |
| Minimum | 44.4% | 88.4% |
| Maximum | 99.8% | 100.0% |
| Range | 55.4% | 11.6% |
| Mean | 90.3% | 97.2% |
| Median | 94.0% | 98.0% |
| Interquartile 25% (IQ1) | 88.8% | 96.8% |
| Interquartile 75% (IQ3) | 96.5% | 99.0% |
| Interquartile Range (IQR) | 7.7% | 2.2% |
| Standard Deviation (Sample) | 11.6% | 3.1% |
| Standard Deviation (Population) | 11.4% | 3.0% |
Similar Demographics by 1st Grade
Demographics Similar to Immigrants from Cambodia by 1st Grade
In terms of 1st grade, the demographic groups most similar to Immigrants from Cambodia are Immigrants from Fiji (96.4%, a difference of 0.020%), Guatemalan (96.5%, a difference of 0.040%), Yakama (96.5%, a difference of 0.060%), Immigrants from Dominican Republic (96.5%, a difference of 0.080%), and Bangladeshi (96.5%, a difference of 0.080%).
| Demographics | Rating | Rank | 1st Grade |
| Immigrants | Vietnam | 0.0 /100 | #330 | Tragic 96.6% |
| Immigrants | Armenia | 0.0 /100 | #331 | Tragic 96.6% |
| Central Americans | 0.0 /100 | #332 | Tragic 96.5% |
| Immigrants | Dominican Republic | 0.0 /100 | #333 | Tragic 96.5% |
| Bangladeshis | 0.0 /100 | #334 | Tragic 96.5% |
| Yakama | 0.0 /100 | #335 | Tragic 96.5% |
| Guatemalans | 0.0 /100 | #336 | Tragic 96.5% |
| Immigrants | Cambodia | 0.0 /100 | #337 | Tragic 96.5% |
| Immigrants | Fiji | 0.0 /100 | #338 | Tragic 96.4% |
| Immigrants | Guatemala | 0.0 /100 | #339 | Tragic 96.4% |
| Immigrants | Cabo Verde | 0.0 /100 | #340 | Tragic 96.3% |
| Immigrants | Central America | 0.0 /100 | #341 | Tragic 96.3% |
| Immigrants | Mexico | 0.0 /100 | #342 | Tragic 96.3% |
| Salvadorans | 0.0 /100 | #343 | Tragic 96.3% |
| Nepalese | 0.0 /100 | #344 | Tragic 96.1% |
Demographics Similar to Arabs by 1st Grade
In terms of 1st grade, the demographic groups most similar to Arabs are Paiute (97.9%, a difference of 0.0%), Pakistani (97.9%, a difference of 0.0%), Immigrants from Kazakhstan (97.9%, a difference of 0.0%), Panamanian (97.9%, a difference of 0.0%), and Immigrants from Belarus (97.9%, a difference of 0.010%).
| Demographics | Rating | Rank | 1st Grade |
| Portuguese | 44.2 /100 | #181 | Average 97.9% |
| Egyptians | 42.7 /100 | #182 | Average 97.9% |
| Immigrants | Argentina | 41.3 /100 | #183 | Average 97.9% |
| Immigrants | Poland | 40.1 /100 | #184 | Average 97.9% |
| Immigrants | Belarus | 39.3 /100 | #185 | Fair 97.9% |
| Paiute | 36.5 /100 | #186 | Fair 97.9% |
| Pakistanis | 35.8 /100 | #187 | Fair 97.9% |
| Arabs | 35.5 /100 | #188 | Fair 97.9% |
| Immigrants | Kazakhstan | 34.9 /100 | #189 | Fair 97.9% |
| Panamanians | 34.1 /100 | #190 | Fair 97.9% |
| Blacks/African Americans | 30.7 /100 | #191 | Fair 97.9% |
| Paraguayans | 30.2 /100 | #192 | Fair 97.9% |
| Immigrants | Taiwan | 29.4 /100 | #193 | Fair 97.9% |
| Mongolians | 29.2 /100 | #194 | Fair 97.9% |
| Hawaiians | 28.8 /100 | #195 | Fair 97.9% |