Immigrants from Cabo Verde vs Zimbabwean Associate's Degree
COMPARE
Immigrants from Cabo Verde
Zimbabwean
Associate's Degree
Associate's Degree Comparison
Immigrants from Cabo Verde
Zimbabweans
36.8%
ASSOCIATE'S DEGREE
0.0/ 100
METRIC RATING
323rd/ 347
METRIC RANK
51.3%
ASSOCIATE'S DEGREE
99.7/ 100
METRIC RATING
65th/ 347
METRIC RANK
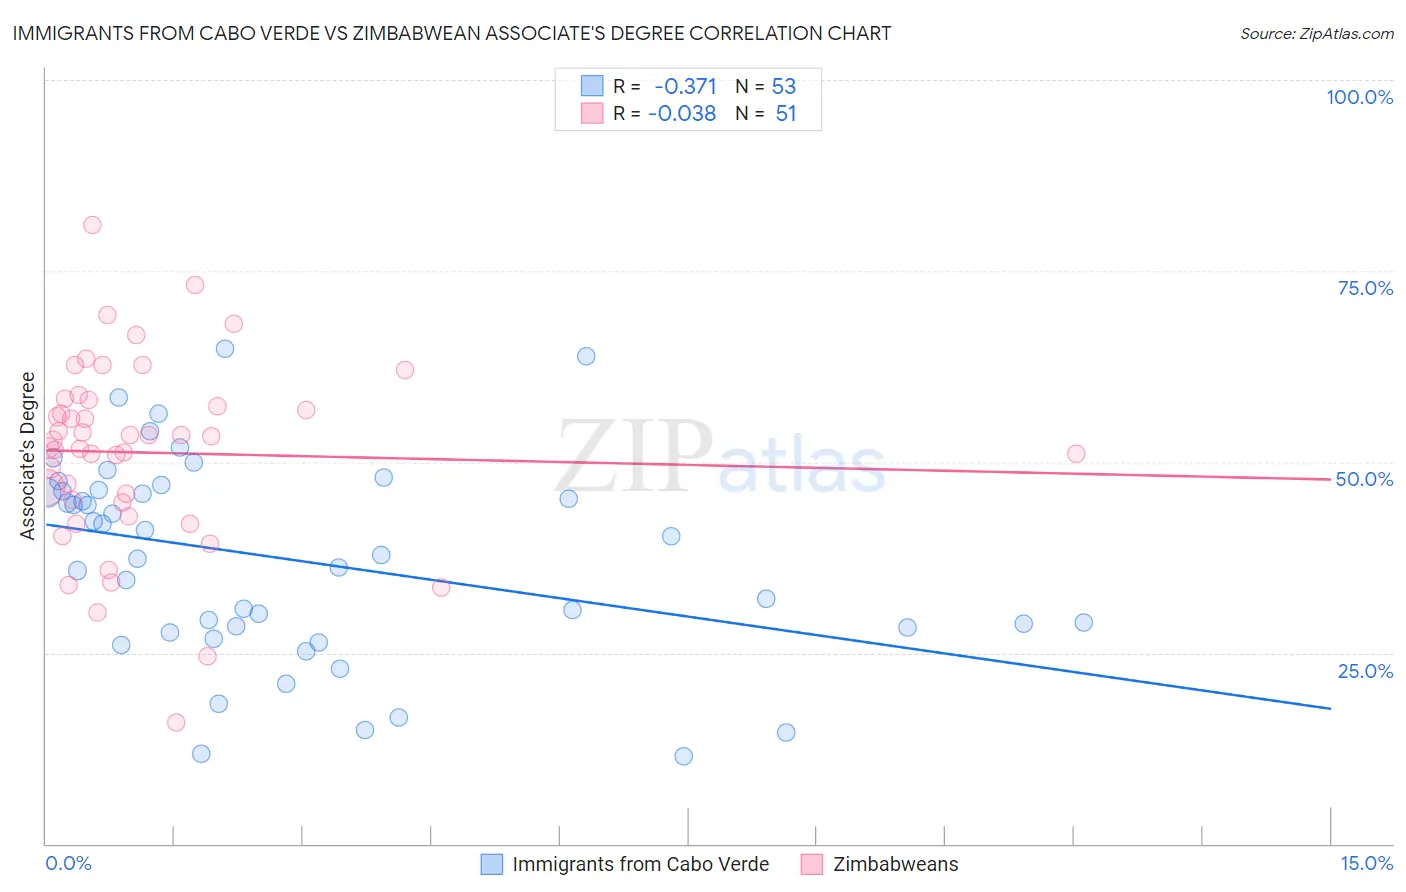
Immigrants from Cabo Verde vs Zimbabwean Associate's Degree Correlation Chart
The statistical analysis conducted on geographies consisting of 38,158,666 people shows a mild negative correlation between the proportion of Immigrants from Cabo Verde and percentage of population with at least associate's degree education in the United States with a correlation coefficient (R) of -0.371 and weighted average of 36.8%. Similarly, the statistical analysis conducted on geographies consisting of 69,203,423 people shows no correlation between the proportion of Zimbabweans and percentage of population with at least associate's degree education in the United States with a correlation coefficient (R) of -0.038 and weighted average of 51.3%, a difference of 39.6%.
Associate's Degree Correlation Summary
| Measurement | Immigrants from Cabo Verde | Zimbabwean |
| Minimum | 11.5% | 15.8% |
| Maximum | 64.7% | 81.0% |
| Range | 53.3% | 65.1% |
| Mean | 37.2% | 51.2% |
| Median | 37.7% | 52.9% |
| Interquartile 25% (IQ1) | 28.0% | 44.7% |
| Interquartile 75% (IQ3) | 46.2% | 58.2% |
| Interquartile Range (IQR) | 18.3% | 13.5% |
| Standard Deviation (Sample) | 13.1% | 12.2% |
| Standard Deviation (Population) | 13.0% | 12.1% |
Similar Demographics by Associate's Degree
Demographics Similar to Immigrants from Cabo Verde by Associate's Degree
In terms of associate's degree, the demographic groups most similar to Immigrants from Cabo Verde are Arapaho (36.7%, a difference of 0.16%), Menominee (36.7%, a difference of 0.27%), Kiowa (36.5%, a difference of 0.83%), Dutch West Indian (36.5%, a difference of 0.85%), and Alaskan Athabascan (36.5%, a difference of 0.86%).
| Demographics | Rating | Rank | Associate's Degree |
| Crow | 0.0 /100 | #316 | Tragic 37.6% |
| Yaqui | 0.0 /100 | #317 | Tragic 37.6% |
| Alaska Natives | 0.0 /100 | #318 | Tragic 37.5% |
| Fijians | 0.0 /100 | #319 | Tragic 37.4% |
| Cajuns | 0.0 /100 | #320 | Tragic 37.4% |
| Immigrants | Yemen | 0.0 /100 | #321 | Tragic 37.3% |
| Pennsylvania Germans | 0.0 /100 | #322 | Tragic 37.2% |
| Immigrants | Cabo Verde | 0.0 /100 | #323 | Tragic 36.8% |
| Arapaho | 0.0 /100 | #324 | Tragic 36.7% |
| Menominee | 0.0 /100 | #325 | Tragic 36.7% |
| Kiowa | 0.0 /100 | #326 | Tragic 36.5% |
| Dutch West Indians | 0.0 /100 | #327 | Tragic 36.5% |
| Alaskan Athabascans | 0.0 /100 | #328 | Tragic 36.5% |
| Paiute | 0.0 /100 | #329 | Tragic 36.4% |
| Apache | 0.0 /100 | #330 | Tragic 36.2% |
Demographics Similar to Zimbabweans by Associate's Degree
In terms of associate's degree, the demographic groups most similar to Zimbabweans are Immigrants from Netherlands (51.4%, a difference of 0.030%), Immigrants from Europe (51.3%, a difference of 0.050%), South African (51.4%, a difference of 0.10%), Immigrants from Kazakhstan (51.4%, a difference of 0.16%), and Bhutanese (51.4%, a difference of 0.16%).
| Demographics | Rating | Rank | Associate's Degree |
| New Zealanders | 99.8 /100 | #58 | Exceptional 51.8% |
| Immigrants | Serbia | 99.8 /100 | #59 | Exceptional 51.7% |
| Immigrants | Bolivia | 99.7 /100 | #60 | Exceptional 51.5% |
| Immigrants | Kazakhstan | 99.7 /100 | #61 | Exceptional 51.4% |
| Bhutanese | 99.7 /100 | #62 | Exceptional 51.4% |
| South Africans | 99.7 /100 | #63 | Exceptional 51.4% |
| Immigrants | Netherlands | 99.7 /100 | #64 | Exceptional 51.4% |
| Zimbabweans | 99.7 /100 | #65 | Exceptional 51.3% |
| Immigrants | Europe | 99.7 /100 | #66 | Exceptional 51.3% |
| Argentineans | 99.6 /100 | #67 | Exceptional 51.2% |
| Immigrants | Indonesia | 99.5 /100 | #68 | Exceptional 51.0% |
| Egyptians | 99.5 /100 | #69 | Exceptional 50.9% |
| Immigrants | Argentina | 99.5 /100 | #70 | Exceptional 50.9% |
| Immigrants | Romania | 99.5 /100 | #71 | Exceptional 50.9% |
| Immigrants | Pakistan | 99.5 /100 | #72 | Exceptional 50.9% |