Immigrants from Bulgaria vs Korean 6th Grade

COMPARE

Immigrants from Bulgaria
Race
Ancestry
AfghanAfricanAlaska NativeAlaskan AthabascanAlbanianAleutAlsatianAmericanApacheArabArapahoArgentineanArmenianAssyrian/Chaldean/SyriacAustralianAustrianBahamianBangladeshiBarbadianBasqueBelgianBelizeanBermudanBhutaneseBlackfeetBolivianBrazilianBritishBritish West IndianBulgarianBurmeseCajunCambodianCanadianCape VerdeanCarpatho RusynCelticCentral AmericanCentral American IndianCherokeeCheyenneChickasawChileanChineseChippewaChoctawColombianColvilleComancheCosta RicanCreeCreekCroatianCrowCubanCypriotCzechCzechoslovakianDanishDelawareDominicanDutchDutch West IndianEastern EuropeanEcuadorianEgyptianEnglishEstonianEthiopianEuropeanFijianFilipinoFinnishFrenchFrench American IndianFrench CanadianGermanGerman RussianGhanaianGreekGuamanian/ChamorroGuatemalanGuyaneseHaitianHmongHonduranHopiHoumaHungarianIcelanderIndian (Asian)IndonesianInupiatIranianIraqiIrishIroquoisIsraeliItalianJamaicanJapaneseJordanianKenyanKiowaLaotianLatvianLebaneseLiberianLithuanianLumbeeLuxembourgerMacedonianMalaysianMalteseMarshalleseMenomineeMexicanMexican American IndianMongolianMoroccanNative HawaiianNavajoNepaleseNew ZealanderNicaraguanNigerianNorthern EuropeanNorwegianOkinawanOsageOttawaPaiutePakistaniPalestinianPanamanianParaguayanPennsylvania GermanPeruvianPimaPolishPortuguesePotawatomiPuebloPuerto RicanPuget Sound SalishRomanianRussianSalvadoranSamoanScandinavianScotch-IrishScottishSeminoleSenegaleseSerbianShoshoneSierra LeoneanSiouxSlavicSlovakSloveneSomaliSouth AfricanSouth AmericanSouth American IndianSoviet UnionSpaniardSpanishSpanish AmericanSpanish American IndianSri LankanSubsaharan AfricanSudaneseSwedishSwissSyrianTaiwaneseThaiTlingit-HaidaTohono O'OdhamTonganTrinidadian and TobagonianTsimshianTurkishU.S. Virgin IslanderUgandanUkrainianUruguayanUteVenezuelanVietnameseWelshWest IndianYakamaYaquiYugoslavianYumanYup'ikZimbabwean
Immigration
NonimmigrantsImmigrantsAfghanistanAfricaAlbaniaArgentinaArmeniaAsiaAustraliaAustriaBahamasBangladeshBarbadosBelarusBelgiumBelizeBoliviaBosnia and HerzegovinaBrazilBulgariaBurma/MyanmarCabo VerdeCambodiaCameroonCanadaCaribbeanCentral AmericaChileChinaColombiaCongoCosta RicaCroatiaCubaCzechoslovakiaDenmarkDominicaDominican RepublicEastern AfricaEastern AsiaEastern EuropeEcuadorEgyptEl SalvadorEnglandEritreaEthiopiaEuropeFijiFranceGermanyGhanaGreeceGrenadaGuatemalaGuyanaHaitiHondurasHong KongHungaryIndiaIndonesiaIranIraqIrelandIsraelItalyJamaicaJapanJordanKazakhstanKenyaKoreaKuwaitLaosLatin AmericaLatviaLebanonLiberiaLithuaniaMalaysiaMexicoMicronesiaMiddle AfricaMoldovaMoroccoNepalNetherlandsNicaraguaNigeriaNorth AmericaNorth MacedoniaNorthern AfricaNorthern EuropeNorwayOceaniaPakistanPanamaPeruPhilippinesPolandPortugalRomaniaRussiaSaudi ArabiaScotlandSenegalSerbiaSierra LeoneSingaporeSomaliaSouth AfricaSouth AmericaSouth Central AsiaSouth Eastern AsiaSouthern EuropeSpainSri LankaSt. Vincent and the GrenadinesSudanSwedenSwitzerlandSyriaTaiwanThailandTrinidad and TobagoTurkeyUgandaUkraineUruguayUzbekistanVenezuelaVietnamWest IndiesWestern AfricaWestern AsiaWestern EuropeYemenZaireZimbabweAzores
Korean
Race
Ancestry
AfghanAfricanAlaska NativeAlaskan AthabascanAlbanianAleutAlsatianAmericanApacheArabArapahoArgentineanArmenianAssyrian/Chaldean/SyriacAustralianAustrianBahamianBangladeshiBarbadianBasqueBelgianBelizeanBermudanBhutaneseBlackfeetBolivianBrazilianBritishBritish West IndianBulgarianBurmeseCajunCambodianCanadianCape VerdeanCarpatho RusynCelticCentral AmericanCentral American IndianCherokeeCheyenneChickasawChileanChineseChippewaChoctawColombianColvilleComancheCosta RicanCreeCreekCroatianCrowCubanCypriotCzechCzechoslovakianDanishDelawareDominicanDutchDutch West IndianEastern EuropeanEcuadorianEgyptianEnglishEstonianEthiopianEuropeanFijianFilipinoFinnishFrenchFrench American IndianFrench CanadianGermanGerman RussianGhanaianGreekGuamanian/ChamorroGuatemalanGuyaneseHaitianHmongHonduranHopiHoumaHungarianIcelanderIndian (Asian)IndonesianInupiatIranianIraqiIrishIroquoisIsraeliItalianJamaicanJapaneseJordanianKenyanKiowaKoreanLaotianLatvianLebaneseLiberianLithuanianLumbeeLuxembourgerMacedonianMalaysianMalteseMarshalleseMenomineeMexicanMexican American IndianMongolianMoroccanNative HawaiianNavajoNepaleseNew ZealanderNicaraguanNigerianNorthern EuropeanNorwegianOkinawanOsageOttawaPaiutePakistaniPalestinianPanamanianParaguayanPennsylvania GermanPeruvianPimaPolishPortuguesePotawatomiPuebloPuerto RicanPuget Sound SalishRomanianRussianSalvadoranSamoanScandinavianScotch-IrishScottishSeminoleSenegaleseSerbianShoshoneSierra LeoneanSiouxSlavicSlovakSloveneSomaliSouth AfricanSouth AmericanSouth American IndianSoviet UnionSpaniardSpanishSpanish AmericanSpanish American IndianSri LankanSubsaharan AfricanSudaneseSwedishSwissSyrianTaiwaneseThaiTlingit-HaidaTohono O'OdhamTonganTrinidadian and TobagonianTsimshianTurkishU.S. Virgin IslanderUgandanUkrainianUruguayanUteVenezuelanVietnameseWelshWest IndianYakamaYaquiYugoslavianYumanYup'ikZimbabwean
Immigration
NonimmigrantsImmigrantsAfghanistanAfricaAlbaniaArgentinaArmeniaAsiaAustraliaAustriaBahamasBangladeshBarbadosBelarusBelgiumBelizeBoliviaBosnia and HerzegovinaBrazilBurma/MyanmarCabo VerdeCambodiaCameroonCanadaCaribbeanCentral AmericaChileChinaColombiaCongoCosta RicaCroatiaCubaCzechoslovakiaDenmarkDominicaDominican RepublicEastern AfricaEastern AsiaEastern EuropeEcuadorEgyptEl SalvadorEnglandEritreaEthiopiaEuropeFijiFranceGermanyGhanaGreeceGrenadaGuatemalaGuyanaHaitiHondurasHong KongHungaryIndiaIndonesiaIranIraqIrelandIsraelItalyJamaicaJapanJordanKazakhstanKenyaKoreaKuwaitLaosLatin AmericaLatviaLebanonLiberiaLithuaniaMalaysiaMexicoMicronesiaMiddle AfricaMoldovaMoroccoNepalNetherlandsNicaraguaNigeriaNorth AmericaNorth MacedoniaNorthern AfricaNorthern EuropeNorwayOceaniaPakistanPanamaPeruPhilippinesPolandPortugalRomaniaRussiaSaudi ArabiaScotlandSenegalSerbiaSierra LeoneSingaporeSomaliaSouth AfricaSouth AmericaSouth Central AsiaSouth Eastern AsiaSouthern EuropeSpainSri LankaSt. Vincent and the GrenadinesSudanSwedenSwitzerlandSyriaTaiwanThailandTrinidad and TobagoTurkeyUgandaUkraineUruguayUzbekistanVenezuelaVietnamWest IndiesWestern AfricaWestern AsiaWestern EuropeYemenZaireZimbabweAzores
6th Grade
Income
Poverty
Unemployment
Labor Participation
Family Structure
Vehicle Availability
Education Level
Disability

6th Grade Comparison

Immigrants from Bulgaria

Koreans

Exceptional
Tragic
97.3%
6TH GRADE
93.6/ 100
METRIC RATING
126th/ 347
METRIC RANK
96.6%
6TH GRADE
1.9/ 100
METRIC RATING
240th/ 347
METRIC RANK

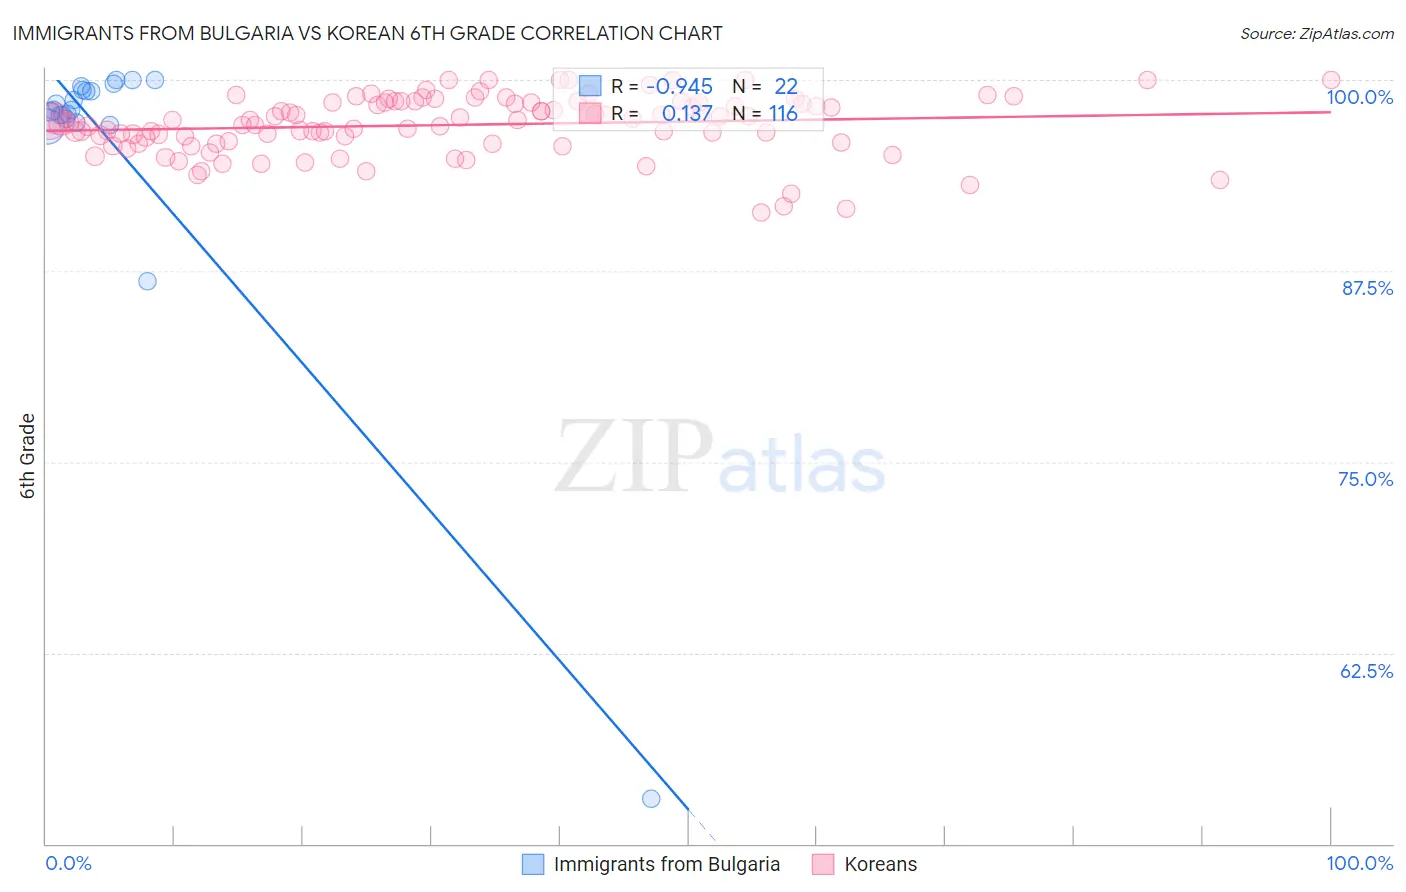
Immigrants from Bulgaria vs Korean 6th Grade Correlation Chart

The statistical analysis conducted on geographies consisting of 172,552,181 people shows a near-perfect negative correlation between the proportion of Immigrants from Bulgaria and percentage of population with at least 6th grade education in the United States with a correlation coefficient (R) of -0.945 and weighted average of 97.3%. Similarly, the statistical analysis conducted on geographies consisting of 510,946,939 people shows a poor positive correlation between the proportion of Koreans and percentage of population with at least 6th grade education in the United States with a correlation coefficient (R) of 0.137 and weighted average of 96.6%, a difference of 0.76%.
Immigrants from Bulgaria vs Korean 6th Grade

6th Grade Correlation Summary

MeasurementImmigrants from BulgariaKorean
Minimum52.9%91.4%
Maximum100.0%100.0%
Range47.1%8.6%
Mean95.9%97.1%
Median98.0%97.3%
Interquartile 25% (IQ1)97.5%95.9%
Interquartile 75% (IQ3)99.4%98.5%
Interquartile Range (IQR)1.9%2.6%
Standard Deviation (Sample)10.0%1.9%
Standard Deviation (Population)9.7%1.9%

Similar Demographics by 6th Grade

Demographics Similar to Immigrants from Bulgaria by 6th Grade

In terms of 6th grade, the demographic groups most similar to Immigrants from Bulgaria are Spanish (97.3%, a difference of 0.0%), Okinawan (97.4%, a difference of 0.010%), Immigrants from Croatia (97.3%, a difference of 0.010%), Immigrants from Norway (97.4%, a difference of 0.020%), and Immigrants from France (97.4%, a difference of 0.020%).
DemographicsRating | Rank6th Grade
Immigrants | Zimbabwe
95.0
/100
|
#119
Exceptional
97.4%
Syrians
94.8
/100
|
#120
Exceptional
97.4%
Immigrants | Norway
94.7
/100
|
#121
Exceptional
97.4%
Immigrants | France
94.5
/100
|
#122
Exceptional
97.4%
Hmong
94.4
/100
|
#123
Exceptional
97.4%
Okinawans
94.2
/100
|
#124
Exceptional
97.4%
Spanish
93.7
/100
|
#125
Exceptional
97.3%
Immigrants | Bulgaria
93.6
/100
|
#126
Exceptional
97.3%
Immigrants | Croatia
93.1
/100
|
#127
Exceptional
97.3%
Immigrants | Romania
92.0
/100
|
#128
Exceptional
97.3%
Immigrants | Serbia
91.9
/100
|
#129
Exceptional
97.3%
Cambodians
91.8
/100
|
#130
Exceptional
97.3%
Immigrants | Europe
91.1
/100
|
#131
Exceptional
97.3%
Palestinians
90.9
/100
|
#132
Exceptional
97.3%
Immigrants | Moldova
90.0
/100
|
#133
Excellent
97.3%

Demographics Similar to Koreans by 6th Grade

In terms of 6th grade, the demographic groups most similar to Koreans are Nigerian (96.6%, a difference of 0.0%), Indian (Asian) (96.6%, a difference of 0.0%), Senegalese (96.6%, a difference of 0.0%), Immigrants from Eastern Africa (96.6%, a difference of 0.010%), and Immigrants from Asia (96.6%, a difference of 0.010%).
DemographicsRating | Rank6th Grade
Yuman
3.2
/100
|
#233
Tragic
96.7%
Uruguayans
2.5
/100
|
#234
Tragic
96.6%
Asians
2.4
/100
|
#235
Tragic
96.6%
Immigrants | Indonesia
2.3
/100
|
#236
Tragic
96.6%
Immigrants | Eastern Africa
2.0
/100
|
#237
Tragic
96.6%
Nigerians
1.9
/100
|
#238
Tragic
96.6%
Indians (Asian)
1.9
/100
|
#239
Tragic
96.6%
Koreans
1.9
/100
|
#240
Tragic
96.6%
Senegalese
1.8
/100
|
#241
Tragic
96.6%
Immigrants | Asia
1.8
/100
|
#242
Tragic
96.6%
Immigrants | Liberia
1.6
/100
|
#243
Tragic
96.6%
Ethiopians
1.5
/100
|
#244
Tragic
96.6%
Immigrants | Costa Rica
1.3
/100
|
#245
Tragic
96.6%
Immigrants | Africa
1.3
/100
|
#246
Tragic
96.6%
Bolivians
1.0
/100
|
#247
Tragic
96.5%