Immigrants from Bulgaria vs Asian Kindergarten

COMPARE

Immigrants from Bulgaria
Race
Ancestry
AfghanAfricanAlaska NativeAlaskan AthabascanAlbanianAleutAlsatianAmericanApacheArabArapahoArgentineanArmenianAssyrian/Chaldean/SyriacAustralianAustrianBahamianBangladeshiBarbadianBasqueBelgianBelizeanBermudanBhutaneseBlackfeetBolivianBrazilianBritishBritish West IndianBulgarianBurmeseCajunCambodianCanadianCape VerdeanCarpatho RusynCelticCentral AmericanCentral American IndianCherokeeCheyenneChickasawChileanChineseChippewaChoctawColombianColvilleComancheCosta RicanCreeCreekCroatianCrowCubanCypriotCzechCzechoslovakianDanishDelawareDominicanDutchDutch West IndianEastern EuropeanEcuadorianEgyptianEnglishEstonianEthiopianEuropeanFijianFilipinoFinnishFrenchFrench American IndianFrench CanadianGermanGerman RussianGhanaianGreekGuamanian/ChamorroGuatemalanGuyaneseHaitianHmongHonduranHopiHoumaHungarianIcelanderIndian (Asian)IndonesianInupiatIranianIraqiIrishIroquoisIsraeliItalianJamaicanJapaneseJordanianKenyanKiowaKoreanLaotianLatvianLebaneseLiberianLithuanianLumbeeLuxembourgerMacedonianMalaysianMalteseMarshalleseMenomineeMexicanMexican American IndianMongolianMoroccanNative HawaiianNavajoNepaleseNew ZealanderNicaraguanNigerianNorthern EuropeanNorwegianOkinawanOsageOttawaPaiutePakistaniPalestinianPanamanianParaguayanPennsylvania GermanPeruvianPimaPolishPortuguesePotawatomiPuebloPuerto RicanPuget Sound SalishRomanianRussianSalvadoranSamoanScandinavianScotch-IrishScottishSeminoleSenegaleseSerbianShoshoneSierra LeoneanSiouxSlavicSlovakSloveneSomaliSouth AfricanSouth AmericanSouth American IndianSoviet UnionSpaniardSpanishSpanish AmericanSpanish American IndianSri LankanSubsaharan AfricanSudaneseSwedishSwissSyrianTaiwaneseThaiTlingit-HaidaTohono O'OdhamTonganTrinidadian and TobagonianTsimshianTurkishU.S. Virgin IslanderUgandanUkrainianUruguayanUteVenezuelanVietnameseWelshWest IndianYakamaYaquiYugoslavianYumanYup'ikZimbabwean
Immigration
NonimmigrantsImmigrantsAfghanistanAfricaAlbaniaArgentinaArmeniaAsiaAustraliaAustriaBahamasBangladeshBarbadosBelarusBelgiumBelizeBoliviaBosnia and HerzegovinaBrazilBulgariaBurma/MyanmarCabo VerdeCambodiaCameroonCanadaCaribbeanCentral AmericaChileChinaColombiaCongoCosta RicaCroatiaCubaCzechoslovakiaDenmarkDominicaDominican RepublicEastern AfricaEastern AsiaEastern EuropeEcuadorEgyptEl SalvadorEnglandEritreaEthiopiaEuropeFijiFranceGermanyGhanaGreeceGrenadaGuatemalaGuyanaHaitiHondurasHong KongHungaryIndiaIndonesiaIranIraqIrelandIsraelItalyJamaicaJapanJordanKazakhstanKenyaKoreaKuwaitLaosLatin AmericaLatviaLebanonLiberiaLithuaniaMalaysiaMexicoMicronesiaMiddle AfricaMoldovaMoroccoNepalNetherlandsNicaraguaNigeriaNorth AmericaNorth MacedoniaNorthern AfricaNorthern EuropeNorwayOceaniaPakistanPanamaPeruPhilippinesPolandPortugalRomaniaRussiaSaudi ArabiaScotlandSenegalSerbiaSierra LeoneSingaporeSomaliaSouth AfricaSouth AmericaSouth Central AsiaSouth Eastern AsiaSouthern EuropeSpainSri LankaSt. Vincent and the GrenadinesSudanSwedenSwitzerlandSyriaTaiwanThailandTrinidad and TobagoTurkeyUgandaUkraineUruguayUzbekistanVenezuelaVietnamWest IndiesWestern AfricaWestern AsiaWestern EuropeYemenZaireZimbabweAzores
Asian
Race
Ancestry
AfghanAfricanAlaska NativeAlaskan AthabascanAlbanianAleutAlsatianAmericanApacheArabArapahoArgentineanArmenianAssyrian/Chaldean/SyriacAustralianAustrianBahamianBangladeshiBarbadianBasqueBelgianBelizeanBermudanBhutaneseBlackfeetBolivianBrazilianBritishBritish West IndianBulgarianBurmeseCajunCambodianCanadianCape VerdeanCarpatho RusynCelticCentral AmericanCentral American IndianCherokeeCheyenneChickasawChileanChineseChippewaChoctawColombianColvilleComancheCosta RicanCreeCreekCroatianCrowCubanCypriotCzechCzechoslovakianDanishDelawareDominicanDutchDutch West IndianEastern EuropeanEcuadorianEgyptianEnglishEstonianEthiopianEuropeanFijianFilipinoFinnishFrenchFrench American IndianFrench CanadianGermanGerman RussianGhanaianGreekGuamanian/ChamorroGuatemalanGuyaneseHaitianHmongHonduranHopiHoumaHungarianIcelanderIndian (Asian)IndonesianInupiatIranianIraqiIrishIroquoisIsraeliItalianJamaicanJapaneseJordanianKenyanKiowaKoreanLaotianLatvianLebaneseLiberianLithuanianLumbeeLuxembourgerMacedonianMalaysianMalteseMarshalleseMenomineeMexicanMexican American IndianMongolianMoroccanNative HawaiianNavajoNepaleseNew ZealanderNicaraguanNigerianNorthern EuropeanNorwegianOkinawanOsageOttawaPaiutePakistaniPalestinianPanamanianParaguayanPennsylvania GermanPeruvianPimaPolishPortuguesePotawatomiPuebloPuerto RicanPuget Sound SalishRomanianRussianSalvadoranSamoanScandinavianScotch-IrishScottishSeminoleSenegaleseSerbianShoshoneSierra LeoneanSiouxSlavicSlovakSloveneSomaliSouth AfricanSouth AmericanSouth American IndianSoviet UnionSpaniardSpanishSpanish AmericanSpanish American IndianSri LankanSubsaharan AfricanSudaneseSwedishSwissSyrianTaiwaneseThaiTlingit-HaidaTohono O'OdhamTonganTrinidadian and TobagonianTsimshianTurkishU.S. Virgin IslanderUgandanUkrainianUruguayanUteVenezuelanVietnameseWelshWest IndianYakamaYaquiYugoslavianYumanYup'ikZimbabwean
Immigration
NonimmigrantsImmigrantsAfghanistanAfricaAlbaniaArgentinaArmeniaAsiaAustraliaAustriaBahamasBangladeshBarbadosBelarusBelgiumBelizeBoliviaBosnia and HerzegovinaBrazilBurma/MyanmarCabo VerdeCambodiaCameroonCanadaCaribbeanCentral AmericaChileChinaColombiaCongoCosta RicaCroatiaCubaCzechoslovakiaDenmarkDominicaDominican RepublicEastern AfricaEastern AsiaEastern EuropeEcuadorEgyptEl SalvadorEnglandEritreaEthiopiaEuropeFijiFranceGermanyGhanaGreeceGrenadaGuatemalaGuyanaHaitiHondurasHong KongHungaryIndiaIndonesiaIranIraqIrelandIsraelItalyJamaicaJapanJordanKazakhstanKenyaKoreaKuwaitLaosLatin AmericaLatviaLebanonLiberiaLithuaniaMalaysiaMexicoMicronesiaMiddle AfricaMoldovaMoroccoNepalNetherlandsNicaraguaNigeriaNorth AmericaNorth MacedoniaNorthern AfricaNorthern EuropeNorwayOceaniaPakistanPanamaPeruPhilippinesPolandPortugalRomaniaRussiaSaudi ArabiaScotlandSenegalSerbiaSierra LeoneSingaporeSomaliaSouth AfricaSouth AmericaSouth Central AsiaSouth Eastern AsiaSouthern EuropeSpainSri LankaSt. Vincent and the GrenadinesSudanSwedenSwitzerlandSyriaTaiwanThailandTrinidad and TobagoTurkeyUgandaUkraineUruguayUzbekistanVenezuelaVietnamWest IndiesWestern AfricaWestern AsiaWestern EuropeYemenZaireZimbabweAzores
Kindergarten
Income
Poverty
Unemployment
Labor Participation
Family Structure
Vehicle Availability
Education Level
Disability

Kindergarten Comparison

Immigrants from Bulgaria

Asians

Excellent
Tragic
98.1%
KINDERGARTEN
89.4/ 100
METRIC RATING
134th/ 347
METRIC RANK
97.6%
KINDERGARTEN
1.2/ 100
METRIC RATING
243rd/ 347
METRIC RANK

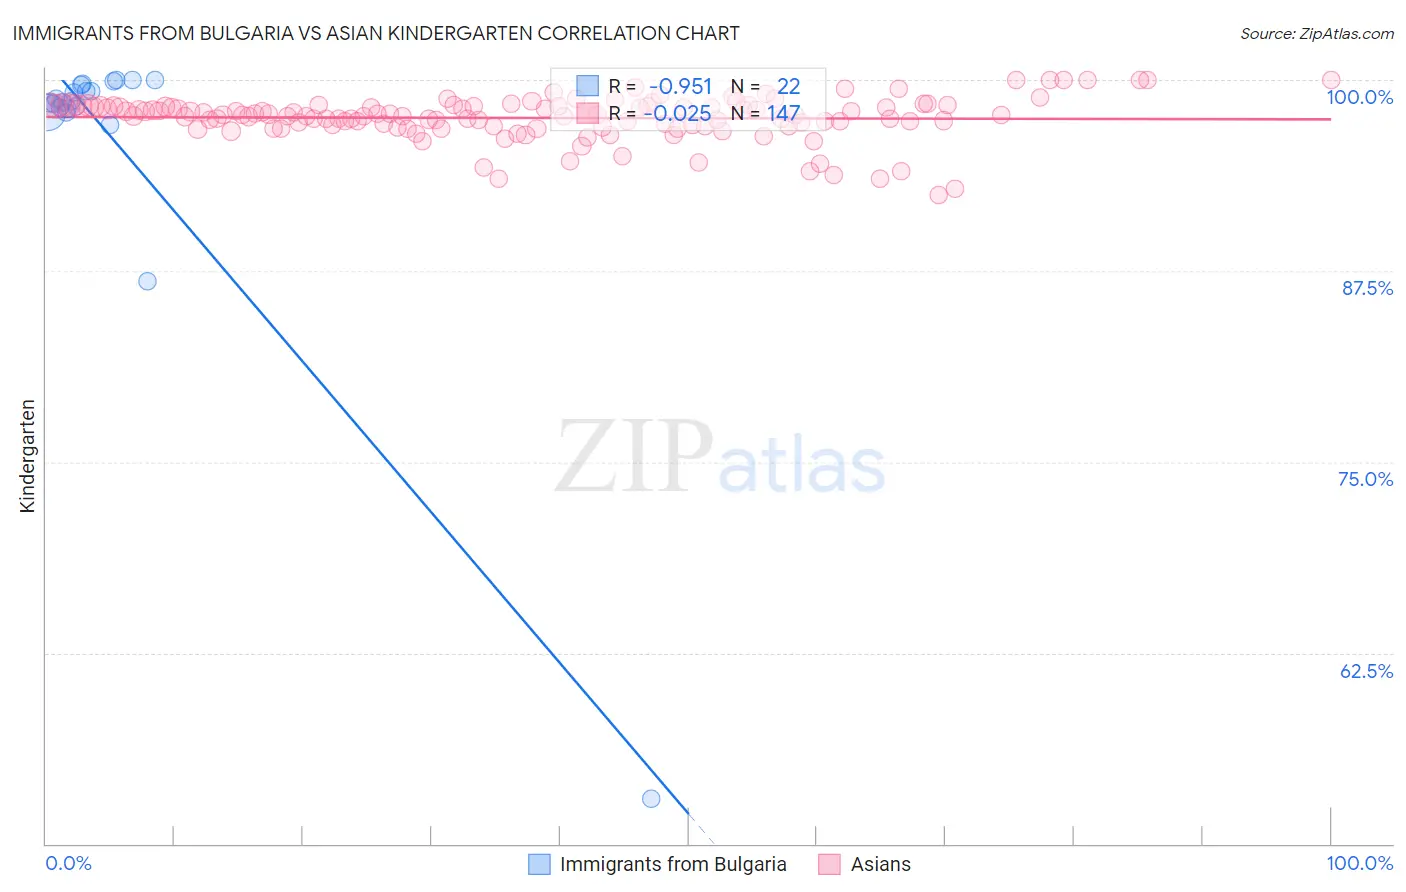
Immigrants from Bulgaria vs Asian Kindergarten Correlation Chart

The statistical analysis conducted on geographies consisting of 172,552,181 people shows a perfect negative correlation between the proportion of Immigrants from Bulgaria and percentage of population with at least kindergarten education in the United States with a correlation coefficient (R) of -0.951 and weighted average of 98.1%. Similarly, the statistical analysis conducted on geographies consisting of 550,722,447 people shows no correlation between the proportion of Asians and percentage of population with at least kindergarten education in the United States with a correlation coefficient (R) of -0.025 and weighted average of 97.6%, a difference of 0.51%.
Immigrants from Bulgaria vs Asian Kindergarten

Kindergarten Correlation Summary

MeasurementImmigrants from BulgariaAsian
Minimum52.9%92.4%
Maximum100.0%100.0%
Range47.1%7.6%
Mean96.2%97.5%
Median98.6%97.7%
Interquartile 25% (IQ1)98.1%97.0%
Interquartile 75% (IQ3)99.7%98.3%
Interquartile Range (IQR)1.5%1.3%
Standard Deviation (Sample)10.0%1.4%
Standard Deviation (Population)9.8%1.4%

Similar Demographics by Kindergarten

Demographics Similar to Immigrants from Bulgaria by Kindergarten

In terms of kindergarten, the demographic groups most similar to Immigrants from Bulgaria are Immigrants from Kuwait (98.1%, a difference of 0.0%), Immigrants from Hungary (98.1%, a difference of 0.0%), Spaniard (98.1%, a difference of 0.010%), Immigrants from Europe (98.1%, a difference of 0.010%), and Blackfeet (98.1%, a difference of 0.010%).
DemographicsRating | RankKindergarten
Immigrants | Saudi Arabia
93.1
/100
|
#127
Exceptional
98.1%
Immigrants | Serbia
92.4
/100
|
#128
Exceptional
98.1%
Seminole
91.5
/100
|
#129
Exceptional
98.1%
Immigrants | Croatia
91.2
/100
|
#130
Exceptional
98.1%
Cambodians
91.2
/100
|
#131
Exceptional
98.1%
Spaniards
91.0
/100
|
#132
Exceptional
98.1%
Immigrants | Europe
90.4
/100
|
#133
Exceptional
98.1%
Immigrants | Bulgaria
89.4
/100
|
#134
Excellent
98.1%
Immigrants | Kuwait
89.2
/100
|
#135
Excellent
98.1%
Immigrants | Hungary
89.1
/100
|
#136
Excellent
98.1%
Blackfeet
87.8
/100
|
#137
Excellent
98.1%
Immigrants | Romania
87.7
/100
|
#138
Excellent
98.1%
Israelis
87.7
/100
|
#139
Excellent
98.1%
Palestinians
83.6
/100
|
#140
Excellent
98.1%
Marshallese
83.0
/100
|
#141
Excellent
98.1%

Demographics Similar to Asians by Kindergarten

In terms of kindergarten, the demographic groups most similar to Asians are Bolivian (97.6%, a difference of 0.0%), Liberian (97.6%, a difference of 0.010%), Immigrants from Indonesia (97.6%, a difference of 0.010%), South American (97.6%, a difference of 0.010%), and Indian (Asian) (97.6%, a difference of 0.010%).
DemographicsRating | RankKindergarten
Immigrants | Western Asia
2.1
/100
|
#236
Tragic
97.7%
Nigerians
1.8
/100
|
#237
Tragic
97.6%
Immigrants | Eastern Asia
1.7
/100
|
#238
Tragic
97.6%
U.S. Virgin Islanders
1.7
/100
|
#239
Tragic
97.6%
Koreans
1.6
/100
|
#240
Tragic
97.6%
Liberians
1.3
/100
|
#241
Tragic
97.6%
Immigrants | Indonesia
1.3
/100
|
#242
Tragic
97.6%
Asians
1.2
/100
|
#243
Tragic
97.6%
Bolivians
1.2
/100
|
#244
Tragic
97.6%
South Americans
1.1
/100
|
#245
Tragic
97.6%
Indians (Asian)
1.0
/100
|
#246
Tragic
97.6%
Immigrants | Eastern Africa
1.0
/100
|
#247
Tragic
97.6%
Immigrants | Middle Africa
1.0
/100
|
#248
Tragic
97.6%
Peruvians
1.0
/100
|
#249
Tragic
97.6%
Immigrants | Senegal
0.9
/100
|
#250
Tragic
97.6%