Immigrants from Brazil vs Immigrants from Greece 2nd Grade

COMPARE

Immigrants from Brazil
Race
Ancestry
AfghanAfricanAlaska NativeAlaskan AthabascanAlbanianAleutAlsatianAmericanApacheArabArapahoArgentineanArmenianAssyrian/Chaldean/SyriacAustralianAustrianBahamianBangladeshiBarbadianBasqueBelgianBelizeanBermudanBhutaneseBlackfeetBolivianBrazilianBritishBritish West IndianBulgarianBurmeseCajunCambodianCanadianCape VerdeanCarpatho RusynCelticCentral AmericanCentral American IndianCherokeeCheyenneChickasawChileanChineseChippewaChoctawColombianColvilleComancheCosta RicanCreeCreekCroatianCrowCubanCypriotCzechCzechoslovakianDanishDelawareDominicanDutchDutch West IndianEastern EuropeanEcuadorianEgyptianEnglishEstonianEthiopianEuropeanFijianFilipinoFinnishFrenchFrench American IndianFrench CanadianGermanGerman RussianGhanaianGreekGuamanian/ChamorroGuatemalanGuyaneseHaitianHmongHonduranHopiHoumaHungarianIcelanderIndian (Asian)IndonesianInupiatIranianIraqiIrishIroquoisIsraeliItalianJamaicanJapaneseJordanianKenyanKiowaKoreanLaotianLatvianLebaneseLiberianLithuanianLumbeeLuxembourgerMacedonianMalaysianMalteseMarshalleseMenomineeMexicanMexican American IndianMongolianMoroccanNative HawaiianNavajoNepaleseNew ZealanderNicaraguanNigerianNorthern EuropeanNorwegianOkinawanOsageOttawaPaiutePakistaniPalestinianPanamanianParaguayanPennsylvania GermanPeruvianPimaPolishPortuguesePotawatomiPuebloPuerto RicanPuget Sound SalishRomanianRussianSalvadoranSamoanScandinavianScotch-IrishScottishSeminoleSenegaleseSerbianShoshoneSierra LeoneanSiouxSlavicSlovakSloveneSomaliSouth AfricanSouth AmericanSouth American IndianSoviet UnionSpaniardSpanishSpanish AmericanSpanish American IndianSri LankanSubsaharan AfricanSudaneseSwedishSwissSyrianTaiwaneseThaiTlingit-HaidaTohono O'OdhamTonganTrinidadian and TobagonianTsimshianTurkishU.S. Virgin IslanderUgandanUkrainianUruguayanUteVenezuelanVietnameseWelshWest IndianYakamaYaquiYugoslavianYumanYup'ikZimbabwean
Immigration
NonimmigrantsImmigrantsAfghanistanAfricaAlbaniaArgentinaArmeniaAsiaAustraliaAustriaBahamasBangladeshBarbadosBelarusBelgiumBelizeBoliviaBosnia and HerzegovinaBrazilBulgariaBurma/MyanmarCabo VerdeCambodiaCameroonCanadaCaribbeanCentral AmericaChileChinaColombiaCongoCosta RicaCroatiaCubaCzechoslovakiaDenmarkDominicaDominican RepublicEastern AfricaEastern AsiaEastern EuropeEcuadorEgyptEl SalvadorEnglandEritreaEthiopiaEuropeFijiFranceGermanyGhanaGrenadaGuatemalaGuyanaHaitiHondurasHong KongHungaryIndiaIndonesiaIranIraqIrelandIsraelItalyJamaicaJapanJordanKazakhstanKenyaKoreaKuwaitLaosLatin AmericaLatviaLebanonLiberiaLithuaniaMalaysiaMexicoMicronesiaMiddle AfricaMoldovaMoroccoNepalNetherlandsNicaraguaNigeriaNorth AmericaNorth MacedoniaNorthern AfricaNorthern EuropeNorwayOceaniaPakistanPanamaPeruPhilippinesPolandPortugalRomaniaRussiaSaudi ArabiaScotlandSenegalSerbiaSierra LeoneSingaporeSomaliaSouth AfricaSouth AmericaSouth Central AsiaSouth Eastern AsiaSouthern EuropeSpainSri LankaSt. Vincent and the GrenadinesSudanSwedenSwitzerlandSyriaTaiwanThailandTrinidad and TobagoTurkeyUgandaUkraineUruguayUzbekistanVenezuelaVietnamWest IndiesWestern AfricaWestern AsiaWestern EuropeYemenZaireZimbabweAzores
Immigrants from Greece
Race
Ancestry
AfghanAfricanAlaska NativeAlaskan AthabascanAlbanianAleutAlsatianAmericanApacheArabArapahoArgentineanArmenianAssyrian/Chaldean/SyriacAustralianAustrianBahamianBangladeshiBarbadianBasqueBelgianBelizeanBermudanBhutaneseBlackfeetBolivianBrazilianBritishBritish West IndianBulgarianBurmeseCajunCambodianCanadianCape VerdeanCarpatho RusynCelticCentral AmericanCentral American IndianCherokeeCheyenneChickasawChileanChineseChippewaChoctawColombianColvilleComancheCosta RicanCreeCreekCroatianCrowCubanCypriotCzechCzechoslovakianDanishDelawareDominicanDutchDutch West IndianEastern EuropeanEcuadorianEgyptianEnglishEstonianEthiopianEuropeanFijianFilipinoFinnishFrenchFrench American IndianFrench CanadianGermanGerman RussianGhanaianGreekGuamanian/ChamorroGuatemalanGuyaneseHaitianHmongHonduranHopiHoumaHungarianIcelanderIndian (Asian)IndonesianInupiatIranianIraqiIrishIroquoisIsraeliItalianJamaicanJapaneseJordanianKenyanKiowaKoreanLaotianLatvianLebaneseLiberianLithuanianLumbeeLuxembourgerMacedonianMalaysianMalteseMarshalleseMenomineeMexicanMexican American IndianMongolianMoroccanNative HawaiianNavajoNepaleseNew ZealanderNicaraguanNigerianNorthern EuropeanNorwegianOkinawanOsageOttawaPaiutePakistaniPalestinianPanamanianParaguayanPennsylvania GermanPeruvianPimaPolishPortuguesePotawatomiPuebloPuerto RicanPuget Sound SalishRomanianRussianSalvadoranSamoanScandinavianScotch-IrishScottishSeminoleSenegaleseSerbianShoshoneSierra LeoneanSiouxSlavicSlovakSloveneSomaliSouth AfricanSouth AmericanSouth American IndianSoviet UnionSpaniardSpanishSpanish AmericanSpanish American IndianSri LankanSubsaharan AfricanSudaneseSwedishSwissSyrianTaiwaneseThaiTlingit-HaidaTohono O'OdhamTonganTrinidadian and TobagonianTsimshianTurkishU.S. Virgin IslanderUgandanUkrainianUruguayanUteVenezuelanVietnameseWelshWest IndianYakamaYaquiYugoslavianYumanYup'ikZimbabwean
Immigration
NonimmigrantsImmigrantsAfghanistanAfricaAlbaniaArgentinaArmeniaAsiaAustraliaAustriaBahamasBangladeshBarbadosBelarusBelgiumBelizeBoliviaBosnia and HerzegovinaBulgariaBurma/MyanmarCabo VerdeCambodiaCameroonCanadaCaribbeanCentral AmericaChileChinaColombiaCongoCosta RicaCroatiaCubaCzechoslovakiaDenmarkDominicaDominican RepublicEastern AfricaEastern AsiaEastern EuropeEcuadorEgyptEl SalvadorEnglandEritreaEthiopiaEuropeFijiFranceGermanyGhanaGreeceGrenadaGuatemalaGuyanaHaitiHondurasHong KongHungaryIndiaIndonesiaIranIraqIrelandIsraelItalyJamaicaJapanJordanKazakhstanKenyaKoreaKuwaitLaosLatin AmericaLatviaLebanonLiberiaLithuaniaMalaysiaMexicoMicronesiaMiddle AfricaMoldovaMoroccoNepalNetherlandsNicaraguaNigeriaNorth AmericaNorth MacedoniaNorthern AfricaNorthern EuropeNorwayOceaniaPakistanPanamaPeruPhilippinesPolandPortugalRomaniaRussiaSaudi ArabiaScotlandSenegalSerbiaSierra LeoneSingaporeSomaliaSouth AfricaSouth AmericaSouth Central AsiaSouth Eastern AsiaSouthern EuropeSpainSri LankaSt. Vincent and the GrenadinesSudanSwedenSwitzerlandSyriaTaiwanThailandTrinidad and TobagoTurkeyUgandaUkraineUruguayUzbekistanVenezuelaVietnamWest IndiesWestern AfricaWestern AsiaWestern EuropeYemenZaireZimbabweAzores
2nd Grade
Income
Poverty
Unemployment
Labor Participation
Family Structure
Vehicle Availability
Education Level
Disability

2nd Grade Comparison

Immigrants from Brazil

Immigrants from Greece

Average
Good
97.9%
2ND GRADE
46.6/ 100
METRIC RATING
177th/ 347
METRIC RANK
98.0%
2ND GRADE
76.8/ 100
METRIC RATING
147th/ 347
METRIC RANK

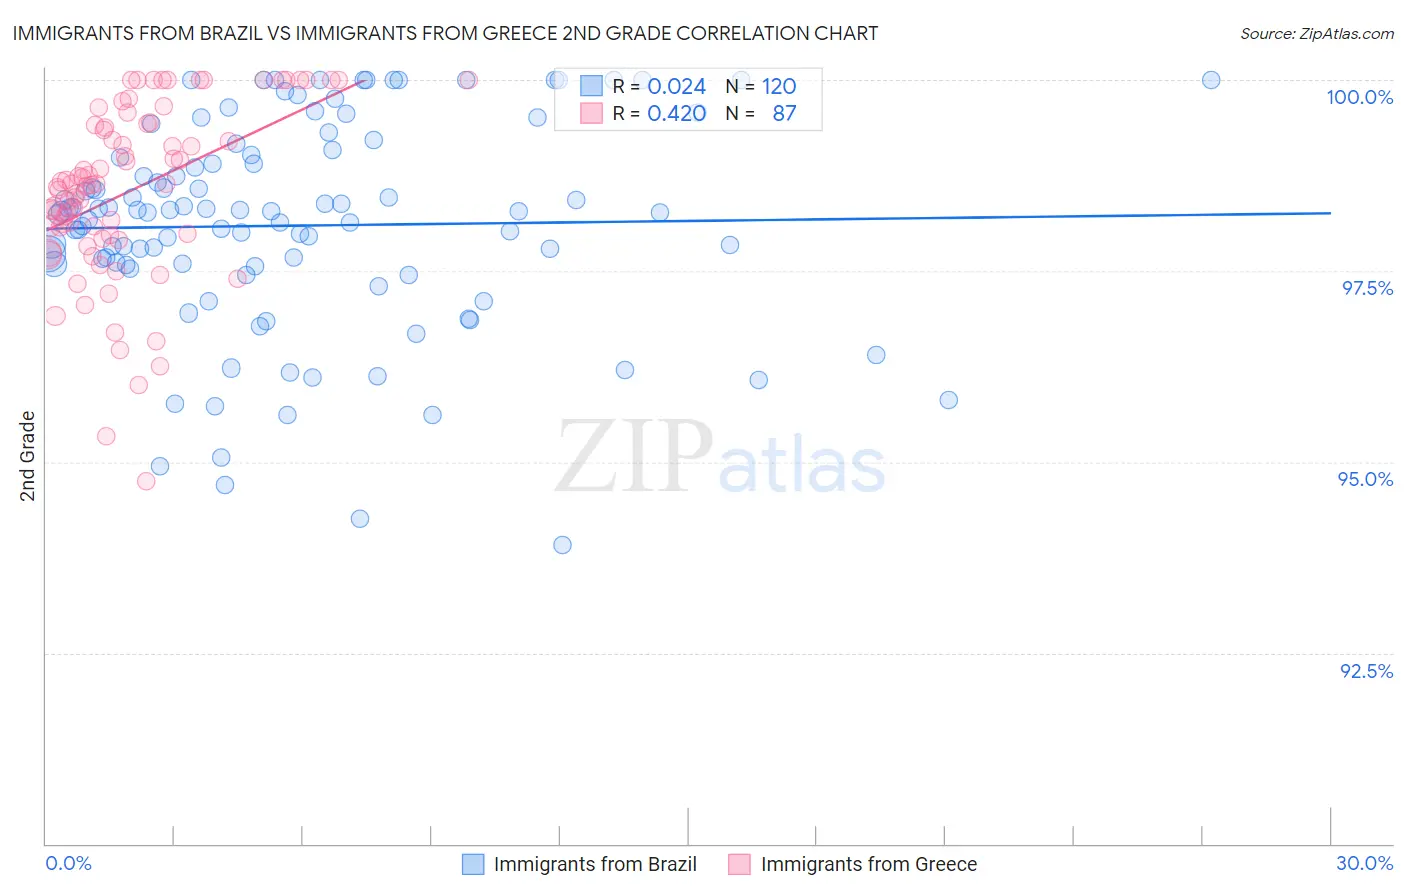
Immigrants from Brazil vs Immigrants from Greece 2nd Grade Correlation Chart

The statistical analysis conducted on geographies consisting of 343,021,580 people shows no correlation between the proportion of Immigrants from Brazil and percentage of population with at least 2nd grade education in the United States with a correlation coefficient (R) of 0.024 and weighted average of 97.9%. Similarly, the statistical analysis conducted on geographies consisting of 216,879,847 people shows a moderate positive correlation between the proportion of Immigrants from Greece and percentage of population with at least 2nd grade education in the United States with a correlation coefficient (R) of 0.420 and weighted average of 98.0%, a difference of 0.11%.
Immigrants from Brazil vs Immigrants from Greece 2nd Grade

2nd Grade Correlation Summary

MeasurementImmigrants from BrazilImmigrants from Greece
Minimum93.9%94.8%
Maximum100.0%100.0%
Range6.1%5.2%
Mean98.1%98.6%
Median98.3%98.6%
Interquartile 25% (IQ1)97.6%98.0%
Interquartile 75% (IQ3)99.0%99.4%
Interquartile Range (IQR)1.4%1.5%
Standard Deviation (Sample)1.4%1.1%
Standard Deviation (Population)1.4%1.1%

Similar Demographics by 2nd Grade

Demographics Similar to Immigrants from Brazil by 2nd Grade

In terms of 2nd grade, the demographic groups most similar to Immigrants from Brazil are Argentinean (97.9%, a difference of 0.0%), Immigrants from Venezuela (97.9%, a difference of 0.0%), Immigrants from Micronesia (97.9%, a difference of 0.010%), Immigrants from Bosnia and Herzegovina (97.9%, a difference of 0.010%), and Immigrants from Sri Lanka (97.9%, a difference of 0.010%).
DemographicsRating | Rank2nd Grade
Navajo
54.3
/100
|
#170
Average
97.9%
Albanians
52.8
/100
|
#171
Average
97.9%
Immigrants | Korea
52.7
/100
|
#172
Average
97.9%
Kenyans
52.7
/100
|
#173
Average
97.9%
Immigrants | Micronesia
50.0
/100
|
#174
Average
97.9%
Immigrants | Bosnia and Herzegovina
49.8
/100
|
#175
Average
97.9%
Immigrants | Sri Lanka
48.7
/100
|
#176
Average
97.9%
Immigrants | Brazil
46.6
/100
|
#177
Average
97.9%
Argentineans
46.3
/100
|
#178
Average
97.9%
Immigrants | Venezuela
46.1
/100
|
#179
Average
97.9%
Natives/Alaskans
44.3
/100
|
#180
Average
97.9%
Egyptians
44.3
/100
|
#181
Average
97.9%
Portuguese
42.4
/100
|
#182
Average
97.8%
Immigrants | Poland
42.2
/100
|
#183
Average
97.8%
Immigrants | Belarus
41.5
/100
|
#184
Average
97.8%

Demographics Similar to Immigrants from Greece by 2nd Grade

In terms of 2nd grade, the demographic groups most similar to Immigrants from Greece are Hmong (98.0%, a difference of 0.010%), Filipino (98.0%, a difference of 0.010%), Immigrants from Israel (98.0%, a difference of 0.010%), Jordanian (98.0%, a difference of 0.010%), and Apache (97.9%, a difference of 0.010%).
DemographicsRating | Rank2nd Grade
Palestinians
83.9
/100
|
#140
Excellent
98.0%
Immigrants | Turkey
83.0
/100
|
#141
Excellent
98.0%
Burmese
81.0
/100
|
#142
Excellent
98.0%
Alsatians
80.5
/100
|
#143
Excellent
98.0%
Hmong
80.0
/100
|
#144
Good
98.0%
Filipinos
79.2
/100
|
#145
Good
98.0%
Immigrants | Israel
78.0
/100
|
#146
Good
98.0%
Immigrants | Greece
76.8
/100
|
#147
Good
98.0%
Jordanians
74.5
/100
|
#148
Good
98.0%
Apache
74.0
/100
|
#149
Good
97.9%
Immigrants | Moldova
72.9
/100
|
#150
Good
97.9%
Soviet Union
70.7
/100
|
#151
Good
97.9%
Immigrants | North Macedonia
68.5
/100
|
#152
Good
97.9%
Immigrants | South Central Asia
68.3
/100
|
#153
Good
97.9%
Marshallese
67.7
/100
|
#154
Good
97.9%