Immigrants from Bosnia and Herzegovina vs Laotian 3rd Grade
COMPARE
Immigrants from Bosnia and Herzegovina
Laotian
3rd Grade
3rd Grade Comparison
Immigrants from Bosnia and Herzegovina
Laotians
97.8%
3RD GRADE
56.2/ 100
METRIC RATING
164th/ 347
METRIC RANK
97.6%
3RD GRADE
9.4/ 100
METRIC RATING
211th/ 347
METRIC RANK
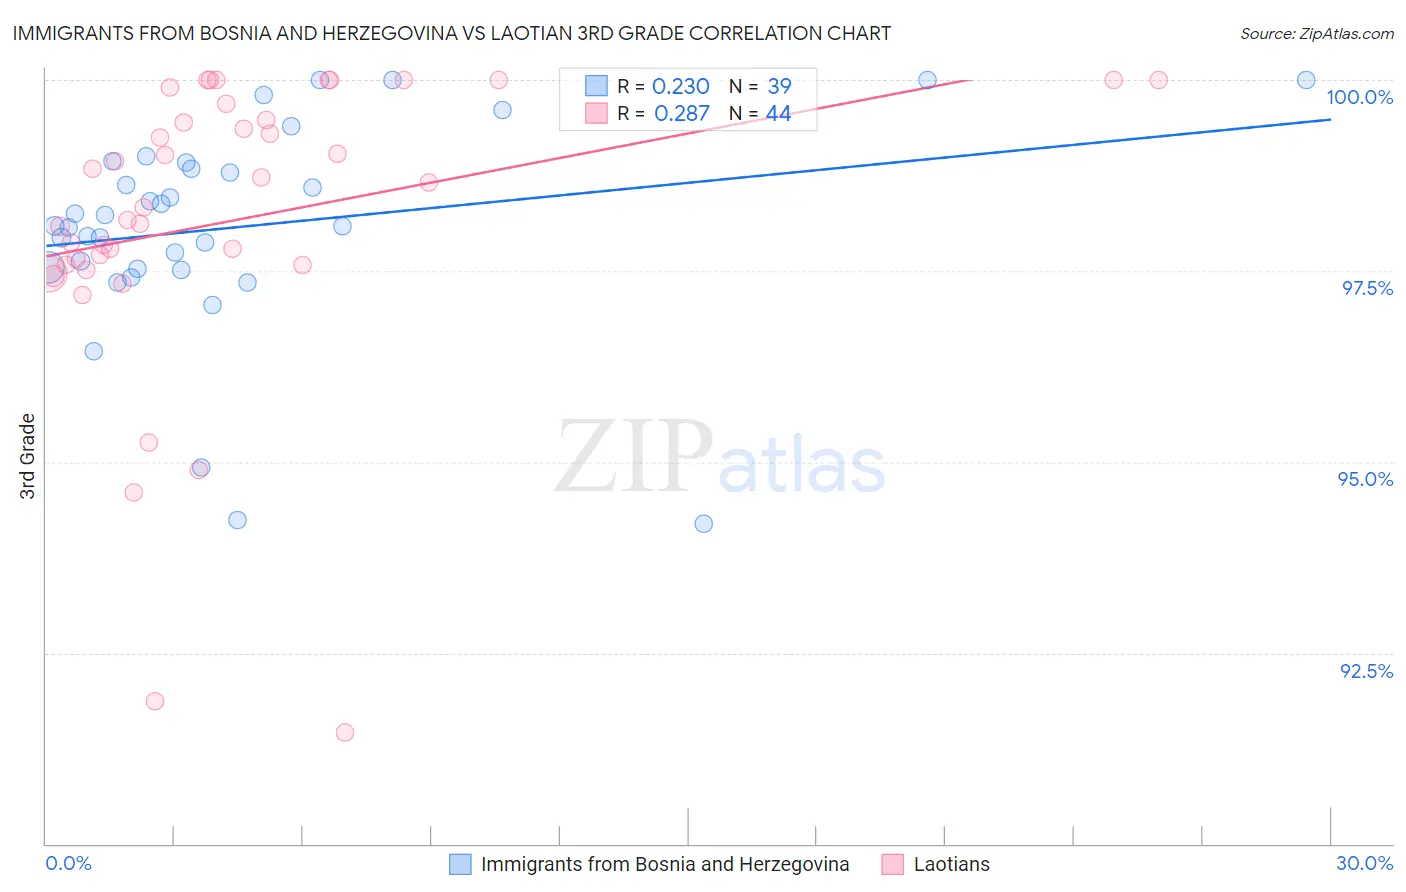
Immigrants from Bosnia and Herzegovina vs Laotian 3rd Grade Correlation Chart
The statistical analysis conducted on geographies consisting of 156,779,463 people shows a weak positive correlation between the proportion of Immigrants from Bosnia and Herzegovina and percentage of population with at least 3rd grade education in the United States with a correlation coefficient (R) of 0.230 and weighted average of 97.8%. Similarly, the statistical analysis conducted on geographies consisting of 224,856,650 people shows a weak positive correlation between the proportion of Laotians and percentage of population with at least 3rd grade education in the United States with a correlation coefficient (R) of 0.287 and weighted average of 97.6%, a difference of 0.21%.
3rd Grade Correlation Summary
| Measurement | Immigrants from Bosnia and Herzegovina | Laotian |
| Minimum | 94.2% | 91.5% |
| Maximum | 100.0% | 100.0% |
| Range | 5.8% | 8.5% |
| Mean | 98.1% | 98.2% |
| Median | 98.1% | 98.5% |
| Interquartile 25% (IQ1) | 97.5% | 97.6% |
| Interquartile 75% (IQ3) | 98.9% | 99.6% |
| Interquartile Range (IQR) | 1.4% | 2.0% |
| Standard Deviation (Sample) | 1.4% | 2.0% |
| Standard Deviation (Population) | 1.4% | 2.0% |
Similar Demographics by 3rd Grade
Demographics Similar to Immigrants from Bosnia and Herzegovina by 3rd Grade
In terms of 3rd grade, the demographic groups most similar to Immigrants from Bosnia and Herzegovina are Marshallese (97.8%, a difference of 0.0%), Ugandan (97.8%, a difference of 0.0%), Dutch West Indian (97.8%, a difference of 0.0%), Chilean (97.8%, a difference of 0.0%), and French American Indian (97.8%, a difference of 0.010%).
| Demographics | Rating | Rank | 3rd Grade |
| Immigrants | Italy | 61.2 /100 | #157 | Good 97.8% |
| Venezuelans | 60.9 /100 | #158 | Good 97.8% |
| French American Indians | 60.0 /100 | #159 | Average 97.8% |
| Immigrants | Iran | 59.1 /100 | #160 | Average 97.8% |
| Albanians | 58.8 /100 | #161 | Average 97.8% |
| Immigrants | Jordan | 57.9 /100 | #162 | Average 97.8% |
| Marshallese | 57.2 /100 | #163 | Average 97.8% |
| Immigrants | Bosnia and Herzegovina | 56.2 /100 | #164 | Average 97.8% |
| Ugandans | 56.1 /100 | #165 | Average 97.8% |
| Dutch West Indians | 55.5 /100 | #166 | Average 97.8% |
| Chileans | 55.3 /100 | #167 | Average 97.8% |
| Immigrants | Spain | 54.3 /100 | #168 | Average 97.8% |
| Comanche | 53.8 /100 | #169 | Average 97.8% |
| Brazilians | 53.7 /100 | #170 | Average 97.8% |
| Kenyans | 51.8 /100 | #171 | Average 97.8% |
Demographics Similar to Laotians by 3rd Grade
In terms of 3rd grade, the demographic groups most similar to Laotians are Costa Rican (97.6%, a difference of 0.0%), Immigrants from Oceania (97.6%, a difference of 0.0%), Immigrants from Bahamas (97.6%, a difference of 0.010%), Moroccan (97.6%, a difference of 0.010%), and Yuman (97.6%, a difference of 0.010%).
| Demographics | Rating | Rank | 3rd Grade |
| Immigrants | Chile | 16.5 /100 | #204 | Poor 97.6% |
| Africans | 14.5 /100 | #205 | Poor 97.6% |
| Immigrants | Northern Africa | 13.0 /100 | #206 | Poor 97.6% |
| Tohono O'odham | 12.5 /100 | #207 | Poor 97.6% |
| Immigrants | Zaire | 11.9 /100 | #208 | Poor 97.6% |
| Costa Ricans | 9.6 /100 | #209 | Tragic 97.6% |
| Immigrants | Oceania | 9.5 /100 | #210 | Tragic 97.6% |
| Laotians | 9.4 /100 | #211 | Tragic 97.6% |
| Immigrants | Bahamas | 8.5 /100 | #212 | Tragic 97.6% |
| Moroccans | 8.5 /100 | #213 | Tragic 97.6% |
| Yuman | 8.4 /100 | #214 | Tragic 97.6% |
| Iraqis | 6.9 /100 | #215 | Tragic 97.5% |
| Samoans | 6.9 /100 | #216 | Tragic 97.5% |
| South American Indians | 5.7 /100 | #217 | Tragic 97.5% |
| Immigrants | Nepal | 5.3 /100 | #218 | Tragic 97.5% |