Immigrants from Bosnia and Herzegovina vs Immigrants from Colombia 12th Grade, No Diploma

COMPARE

Immigrants from Bosnia and Herzegovina
Race
Ancestry
AfghanAfricanAlaska NativeAlaskan AthabascanAlbanianAleutAlsatianAmericanApacheArabArapahoArgentineanArmenianAssyrian/Chaldean/SyriacAustralianAustrianBahamianBangladeshiBarbadianBasqueBelgianBelizeanBermudanBhutaneseBlackfeetBolivianBrazilianBritishBritish West IndianBulgarianBurmeseCajunCambodianCanadianCape VerdeanCarpatho RusynCelticCentral AmericanCentral American IndianCherokeeCheyenneChickasawChileanChineseChippewaChoctawColombianColvilleComancheCosta RicanCreeCreekCroatianCrowCubanCypriotCzechCzechoslovakianDanishDelawareDominicanDutchDutch West IndianEastern EuropeanEcuadorianEgyptianEnglishEstonianEthiopianEuropeanFijianFilipinoFinnishFrenchFrench American IndianFrench CanadianGermanGerman RussianGhanaianGreekGuamanian/ChamorroGuatemalanGuyaneseHaitianHmongHonduranHopiHoumaHungarianIcelanderIndian (Asian)IndonesianInupiatIranianIraqiIrishIroquoisIsraeliItalianJamaicanJapaneseJordanianKenyanKiowaKoreanLaotianLatvianLebaneseLiberianLithuanianLumbeeLuxembourgerMacedonianMalaysianMalteseMarshalleseMenomineeMexicanMexican American IndianMongolianMoroccanNative HawaiianNavajoNepaleseNew ZealanderNicaraguanNigerianNorthern EuropeanNorwegianOkinawanOsageOttawaPaiutePakistaniPalestinianPanamanianParaguayanPennsylvania GermanPeruvianPimaPolishPortuguesePotawatomiPuebloPuerto RicanPuget Sound SalishRomanianRussianSalvadoranSamoanScandinavianScotch-IrishScottishSeminoleSenegaleseSerbianShoshoneSierra LeoneanSiouxSlavicSlovakSloveneSomaliSouth AfricanSouth AmericanSouth American IndianSoviet UnionSpaniardSpanishSpanish AmericanSpanish American IndianSri LankanSubsaharan AfricanSudaneseSwedishSwissSyrianTaiwaneseThaiTlingit-HaidaTohono O'OdhamTonganTrinidadian and TobagonianTsimshianTurkishU.S. Virgin IslanderUgandanUkrainianUruguayanUteVenezuelanVietnameseWelshWest IndianYakamaYaquiYugoslavianYumanYup'ikZimbabwean
Immigration
NonimmigrantsImmigrantsAfghanistanAfricaAlbaniaArgentinaArmeniaAsiaAustraliaAustriaBahamasBangladeshBarbadosBelarusBelgiumBelizeBoliviaBosnia and HerzegovinaBrazilBulgariaBurma/MyanmarCabo VerdeCambodiaCameroonCanadaCaribbeanCentral AmericaChileChinaCongoCosta RicaCroatiaCubaCzechoslovakiaDenmarkDominicaDominican RepublicEastern AfricaEastern AsiaEastern EuropeEcuadorEgyptEl SalvadorEnglandEritreaEthiopiaEuropeFijiFranceGermanyGhanaGreeceGrenadaGuatemalaGuyanaHaitiHondurasHong KongHungaryIndiaIndonesiaIranIraqIrelandIsraelItalyJamaicaJapanJordanKazakhstanKenyaKoreaKuwaitLaosLatin AmericaLatviaLebanonLiberiaLithuaniaMalaysiaMexicoMicronesiaMiddle AfricaMoldovaMoroccoNepalNetherlandsNicaraguaNigeriaNorth AmericaNorth MacedoniaNorthern AfricaNorthern EuropeNorwayOceaniaPakistanPanamaPeruPhilippinesPolandPortugalRomaniaRussiaSaudi ArabiaScotlandSenegalSerbiaSierra LeoneSingaporeSomaliaSouth AfricaSouth AmericaSouth Central AsiaSouth Eastern AsiaSouthern EuropeSpainSri LankaSt. Vincent and the GrenadinesSudanSwedenSwitzerlandSyriaTaiwanThailandTrinidad and TobagoTurkeyUgandaUkraineUruguayUzbekistanVenezuelaVietnamWest IndiesWestern AfricaWestern AsiaWestern EuropeYemenZaireZimbabweAzores
Immigrants from Colombia
Race
Ancestry
AfghanAfricanAlaska NativeAlaskan AthabascanAlbanianAleutAlsatianAmericanApacheArabArapahoArgentineanArmenianAssyrian/Chaldean/SyriacAustralianAustrianBahamianBangladeshiBarbadianBasqueBelgianBelizeanBermudanBhutaneseBlackfeetBolivianBrazilianBritishBritish West IndianBulgarianBurmeseCajunCambodianCanadianCape VerdeanCarpatho RusynCelticCentral AmericanCentral American IndianCherokeeCheyenneChickasawChileanChineseChippewaChoctawColombianColvilleComancheCosta RicanCreeCreekCroatianCrowCubanCypriotCzechCzechoslovakianDanishDelawareDominicanDutchDutch West IndianEastern EuropeanEcuadorianEgyptianEnglishEstonianEthiopianEuropeanFijianFilipinoFinnishFrenchFrench American IndianFrench CanadianGermanGerman RussianGhanaianGreekGuamanian/ChamorroGuatemalanGuyaneseHaitianHmongHonduranHopiHoumaHungarianIcelanderIndian (Asian)IndonesianInupiatIranianIraqiIrishIroquoisIsraeliItalianJamaicanJapaneseJordanianKenyanKiowaKoreanLaotianLatvianLebaneseLiberianLithuanianLumbeeLuxembourgerMacedonianMalaysianMalteseMarshalleseMenomineeMexicanMexican American IndianMongolianMoroccanNative HawaiianNavajoNepaleseNew ZealanderNicaraguanNigerianNorthern EuropeanNorwegianOkinawanOsageOttawaPaiutePakistaniPalestinianPanamanianParaguayanPennsylvania GermanPeruvianPimaPolishPortuguesePotawatomiPuebloPuerto RicanPuget Sound SalishRomanianRussianSalvadoranSamoanScandinavianScotch-IrishScottishSeminoleSenegaleseSerbianShoshoneSierra LeoneanSiouxSlavicSlovakSloveneSomaliSouth AfricanSouth AmericanSouth American IndianSoviet UnionSpaniardSpanishSpanish AmericanSpanish American IndianSri LankanSubsaharan AfricanSudaneseSwedishSwissSyrianTaiwaneseThaiTlingit-HaidaTohono O'OdhamTonganTrinidadian and TobagonianTsimshianTurkishU.S. Virgin IslanderUgandanUkrainianUruguayanUteVenezuelanVietnameseWelshWest IndianYakamaYaquiYugoslavianYumanYup'ikZimbabwean
Immigration
NonimmigrantsImmigrantsAfghanistanAfricaAlbaniaArgentinaArmeniaAsiaAustraliaAustriaBahamasBangladeshBarbadosBelarusBelgiumBelizeBoliviaBrazilBulgariaBurma/MyanmarCabo VerdeCambodiaCameroonCanadaCaribbeanCentral AmericaChileChinaColombiaCongoCosta RicaCroatiaCubaCzechoslovakiaDenmarkDominicaDominican RepublicEastern AfricaEastern AsiaEastern EuropeEcuadorEgyptEl SalvadorEnglandEritreaEthiopiaEuropeFijiFranceGermanyGhanaGreeceGrenadaGuatemalaGuyanaHaitiHondurasHong KongHungaryIndiaIndonesiaIranIraqIrelandIsraelItalyJamaicaJapanJordanKazakhstanKenyaKoreaKuwaitLaosLatin AmericaLatviaLebanonLiberiaLithuaniaMalaysiaMexicoMicronesiaMiddle AfricaMoldovaMoroccoNepalNetherlandsNicaraguaNigeriaNorth AmericaNorth MacedoniaNorthern AfricaNorthern EuropeNorwayOceaniaPakistanPanamaPeruPhilippinesPolandPortugalRomaniaRussiaSaudi ArabiaScotlandSenegalSerbiaSierra LeoneSingaporeSomaliaSouth AfricaSouth AmericaSouth Central AsiaSouth Eastern AsiaSouthern EuropeSpainSri LankaSt. Vincent and the GrenadinesSudanSwedenSwitzerlandSyriaTaiwanThailandTrinidad and TobagoTurkeyUgandaUkraineUruguayUzbekistanVenezuelaVietnamWest IndiesWestern AfricaWestern AsiaWestern EuropeYemenZaireZimbabweAzores
12th Grade, No Diploma
Income
Poverty
Unemployment
Labor Participation
Family Structure
Vehicle Availability
Education Level
Disability

12th Grade, No Diploma Comparison

Immigrants from Bosnia and Herzegovina

Immigrants from Colombia

Excellent
Tragic
91.7%
12TH GRADE, NO DIPLOMA
87.3/ 100
METRIC RATING
135th/ 347
METRIC RANK
90.1%
12TH GRADE, NO DIPLOMA
2.1/ 100
METRIC RATING
237th/ 347
METRIC RANK

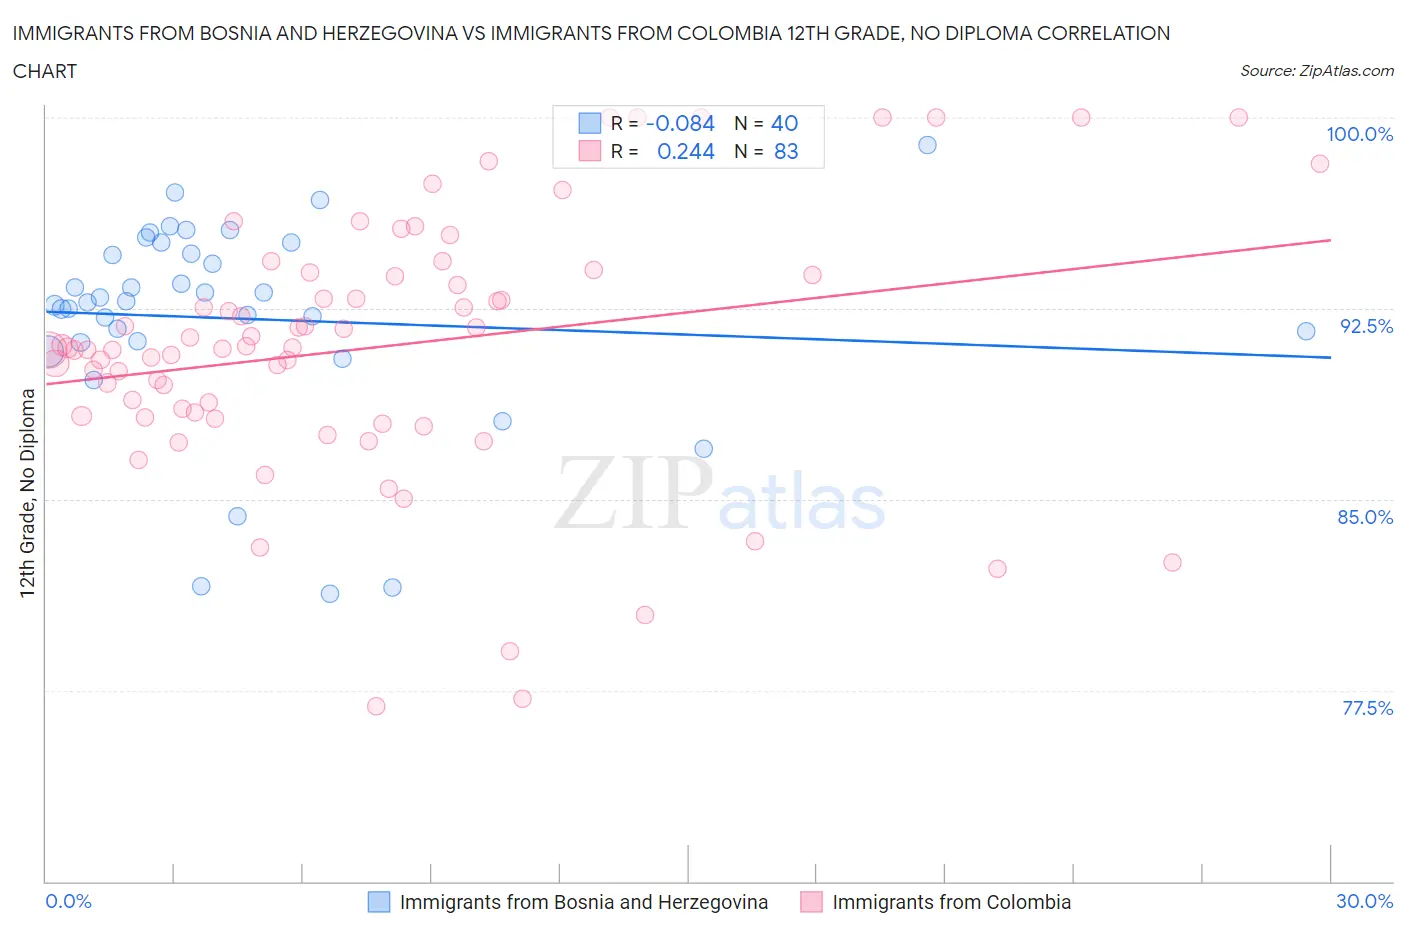
Immigrants from Bosnia and Herzegovina vs Immigrants from Colombia 12th Grade, No Diploma Correlation Chart

The statistical analysis conducted on geographies consisting of 156,819,615 people shows a slight negative correlation between the proportion of Immigrants from Bosnia and Herzegovina and percentage of population with at least 12th grade (no diploma) education in the United States with a correlation coefficient (R) of -0.084 and weighted average of 91.7%. Similarly, the statistical analysis conducted on geographies consisting of 378,643,826 people shows a weak positive correlation between the proportion of Immigrants from Colombia and percentage of population with at least 12th grade (no diploma) education in the United States with a correlation coefficient (R) of 0.244 and weighted average of 90.1%, a difference of 1.8%.
Immigrants from Bosnia and Herzegovina vs Immigrants from Colombia 12th Grade, No Diploma

12th Grade, No Diploma Correlation Summary

MeasurementImmigrants from Bosnia and HerzegovinaImmigrants from Colombia
Minimum81.3%76.9%
Maximum98.9%100.0%
Range17.7%23.1%
Mean92.1%91.0%
Median92.8%90.9%
Interquartile 25% (IQ1)91.2%88.3%
Interquartile 75% (IQ3)94.9%93.8%
Interquartile Range (IQR)3.7%5.5%
Standard Deviation (Sample)4.1%5.1%
Standard Deviation (Population)4.0%5.0%

Similar Demographics by 12th Grade, No Diploma

Demographics Similar to Immigrants from Bosnia and Herzegovina by 12th Grade, No Diploma

In terms of 12th grade, no diploma, the demographic groups most similar to Immigrants from Bosnia and Herzegovina are Immigrants from Italy (91.7%, a difference of 0.030%), Venezuelan (91.7%, a difference of 0.030%), Chilean (91.7%, a difference of 0.040%), Albanian (91.8%, a difference of 0.060%), and Immigrants from Eastern Asia (91.8%, a difference of 0.060%).
DemographicsRating | Rank12th Grade, No Diploma
Mongolians
89.9
/100
|
#128
Excellent
91.8%
German Russians
89.8
/100
|
#129
Excellent
91.8%
Assyrians/Chaldeans/Syriacs
89.6
/100
|
#130
Excellent
91.8%
Albanians
89.3
/100
|
#131
Excellent
91.8%
Immigrants | Eastern Asia
89.3
/100
|
#132
Excellent
91.8%
Immigrants | Italy
88.3
/100
|
#133
Excellent
91.7%
Venezuelans
88.2
/100
|
#134
Excellent
91.7%
Immigrants | Bosnia and Herzegovina
87.3
/100
|
#135
Excellent
91.7%
Chileans
85.8
/100
|
#136
Excellent
91.7%
Alaska Natives
84.9
/100
|
#137
Excellent
91.6%
Arabs
84.1
/100
|
#138
Excellent
91.6%
Immigrants | Egypt
83.9
/100
|
#139
Excellent
91.6%
Immigrants | Poland
82.3
/100
|
#140
Excellent
91.6%
Argentineans
82.0
/100
|
#141
Excellent
91.6%
Immigrants | Venezuela
80.9
/100
|
#142
Excellent
91.6%

Demographics Similar to Immigrants from Colombia by 12th Grade, No Diploma

In terms of 12th grade, no diploma, the demographic groups most similar to Immigrants from Colombia are Inupiat (90.1%, a difference of 0.010%), Immigrants from Thailand (90.1%, a difference of 0.030%), Immigrants from South America (90.1%, a difference of 0.030%), Colville (90.1%, a difference of 0.030%), and Immigrants from Uzbekistan (90.1%, a difference of 0.030%).
DemographicsRating | Rank12th Grade, No Diploma
Immigrants | Philippines
2.8
/100
|
#230
Tragic
90.2%
Peruvians
2.7
/100
|
#231
Tragic
90.2%
Blackfeet
2.4
/100
|
#232
Tragic
90.1%
Immigrants | Thailand
2.3
/100
|
#233
Tragic
90.1%
Immigrants | South America
2.3
/100
|
#234
Tragic
90.1%
Colville
2.3
/100
|
#235
Tragic
90.1%
Immigrants | Uzbekistan
2.2
/100
|
#236
Tragic
90.1%
Immigrants | Colombia
2.1
/100
|
#237
Tragic
90.1%
Inupiat
2.0
/100
|
#238
Tragic
90.1%
Sub-Saharan Africans
1.9
/100
|
#239
Tragic
90.1%
Kiowa
1.7
/100
|
#240
Tragic
90.0%
Immigrants | Middle Africa
1.7
/100
|
#241
Tragic
90.0%
Immigrants | Costa Rica
1.6
/100
|
#242
Tragic
90.0%
Crow
1.5
/100
|
#243
Tragic
90.0%
Taiwanese
1.5
/100
|
#244
Tragic
90.0%