Immigrants from Bosnia and Herzegovina vs Apache 1st Grade

COMPARE

Immigrants from Bosnia and Herzegovina
Race
Ancestry
AfghanAfricanAlaska NativeAlaskan AthabascanAlbanianAleutAlsatianAmericanArabArapahoArgentineanArmenianAssyrian/Chaldean/SyriacAustralianAustrianBahamianBangladeshiBarbadianBasqueBelgianBelizeanBermudanBhutaneseBlackfeetBolivianBrazilianBritishBritish West IndianBulgarianBurmeseCajunCambodianCanadianCape VerdeanCarpatho RusynCelticCentral AmericanCentral American IndianCherokeeCheyenneChickasawChileanChineseChippewaChoctawColombianColvilleComancheCosta RicanCreeCreekCroatianCrowCubanCypriotCzechCzechoslovakianDanishDelawareDominicanDutchDutch West IndianEastern EuropeanEcuadorianEgyptianEnglishEstonianEthiopianEuropeanFijianFilipinoFinnishFrenchFrench American IndianFrench CanadianGermanGerman RussianGhanaianGreekGuamanian/ChamorroGuatemalanGuyaneseHaitianHmongHonduranHopiHoumaHungarianIcelanderIndian (Asian)IndonesianInupiatIranianIraqiIrishIroquoisIsraeliItalianJamaicanJapaneseJordanianKenyanKiowaKoreanLaotianLatvianLebaneseLiberianLithuanianLumbeeLuxembourgerMacedonianMalaysianMalteseMarshalleseMenomineeMexicanMexican American IndianMongolianMoroccanNative HawaiianNavajoNepaleseNew ZealanderNicaraguanNigerianNorthern EuropeanNorwegianOkinawanOsageOttawaPaiutePakistaniPalestinianPanamanianParaguayanPennsylvania GermanPeruvianPimaPolishPortuguesePotawatomiPuebloPuerto RicanPuget Sound SalishRomanianRussianSalvadoranSamoanScandinavianScotch-IrishScottishSeminoleSenegaleseSerbianShoshoneSierra LeoneanSiouxSlavicSlovakSloveneSomaliSouth AfricanSouth AmericanSouth American IndianSoviet UnionSpaniardSpanishSpanish AmericanSpanish American IndianSri LankanSubsaharan AfricanSudaneseSwedishSwissSyrianTaiwaneseThaiTlingit-HaidaTohono O'OdhamTonganTrinidadian and TobagonianTsimshianTurkishU.S. Virgin IslanderUgandanUkrainianUruguayanUteVenezuelanVietnameseWelshWest IndianYakamaYaquiYugoslavianYumanYup'ikZimbabwean
Immigration
NonimmigrantsImmigrantsAfghanistanAfricaAlbaniaArgentinaArmeniaAsiaAustraliaAustriaBahamasBangladeshBarbadosBelarusBelgiumBelizeBoliviaBosnia and HerzegovinaBrazilBulgariaBurma/MyanmarCabo VerdeCambodiaCameroonCanadaCaribbeanCentral AmericaChileChinaColombiaCongoCosta RicaCroatiaCubaCzechoslovakiaDenmarkDominicaDominican RepublicEastern AfricaEastern AsiaEastern EuropeEcuadorEgyptEl SalvadorEnglandEritreaEthiopiaEuropeFijiFranceGermanyGhanaGreeceGrenadaGuatemalaGuyanaHaitiHondurasHong KongHungaryIndiaIndonesiaIranIraqIrelandIsraelItalyJamaicaJapanJordanKazakhstanKenyaKoreaKuwaitLaosLatin AmericaLatviaLebanonLiberiaLithuaniaMalaysiaMexicoMicronesiaMiddle AfricaMoldovaMoroccoNepalNetherlandsNicaraguaNigeriaNorth AmericaNorth MacedoniaNorthern AfricaNorthern EuropeNorwayOceaniaPakistanPanamaPeruPhilippinesPolandPortugalRomaniaRussiaSaudi ArabiaScotlandSenegalSerbiaSierra LeoneSingaporeSomaliaSouth AfricaSouth AmericaSouth Central AsiaSouth Eastern AsiaSouthern EuropeSpainSri LankaSt. Vincent and the GrenadinesSudanSwedenSwitzerlandSyriaTaiwanThailandTrinidad and TobagoTurkeyUgandaUkraineUruguayUzbekistanVenezuelaVietnamWest IndiesWestern AfricaWestern AsiaWestern EuropeYemenZaireZimbabweAzores
Apache
Race
Ancestry
AfghanAfricanAlaska NativeAlaskan AthabascanAlbanianAleutAlsatianAmericanApacheArabArapahoArgentineanArmenianAssyrian/Chaldean/SyriacAustralianAustrianBahamianBangladeshiBarbadianBasqueBelgianBelizeanBermudanBhutaneseBlackfeetBolivianBrazilianBritishBritish West IndianBulgarianBurmeseCajunCambodianCanadianCape VerdeanCarpatho RusynCelticCentral AmericanCentral American IndianCherokeeCheyenneChickasawChileanChineseChippewaChoctawColombianColvilleComancheCosta RicanCreeCreekCroatianCrowCubanCypriotCzechCzechoslovakianDanishDelawareDominicanDutchDutch West IndianEastern EuropeanEcuadorianEgyptianEnglishEstonianEthiopianEuropeanFijianFilipinoFinnishFrenchFrench American IndianFrench CanadianGermanGerman RussianGhanaianGreekGuamanian/ChamorroGuatemalanGuyaneseHaitianHmongHonduranHopiHoumaHungarianIcelanderIndian (Asian)IndonesianInupiatIranianIraqiIrishIroquoisIsraeliItalianJamaicanJapaneseJordanianKenyanKiowaKoreanLaotianLatvianLebaneseLiberianLithuanianLumbeeLuxembourgerMacedonianMalaysianMalteseMarshalleseMenomineeMexicanMexican American IndianMongolianMoroccanNative HawaiianNavajoNepaleseNew ZealanderNicaraguanNigerianNorthern EuropeanNorwegianOkinawanOsageOttawaPaiutePakistaniPalestinianPanamanianParaguayanPennsylvania GermanPeruvianPimaPolishPortuguesePotawatomiPuebloPuerto RicanPuget Sound SalishRomanianRussianSalvadoranSamoanScandinavianScotch-IrishScottishSeminoleSenegaleseSerbianShoshoneSierra LeoneanSiouxSlavicSlovakSloveneSomaliSouth AfricanSouth AmericanSouth American IndianSoviet UnionSpaniardSpanishSpanish AmericanSpanish American IndianSri LankanSubsaharan AfricanSudaneseSwedishSwissSyrianTaiwaneseThaiTlingit-HaidaTohono O'OdhamTonganTrinidadian and TobagonianTsimshianTurkishU.S. Virgin IslanderUgandanUkrainianUruguayanUteVenezuelanVietnameseWelshWest IndianYakamaYaquiYugoslavianYumanYup'ikZimbabwean
Immigration
NonimmigrantsImmigrantsAfghanistanAfricaAlbaniaArgentinaArmeniaAsiaAustraliaAustriaBahamasBangladeshBarbadosBelarusBelgiumBelizeBoliviaBrazilBulgariaBurma/MyanmarCabo VerdeCambodiaCameroonCanadaCaribbeanCentral AmericaChileChinaColombiaCongoCosta RicaCroatiaCubaCzechoslovakiaDenmarkDominicaDominican RepublicEastern AfricaEastern AsiaEastern EuropeEcuadorEgyptEl SalvadorEnglandEritreaEthiopiaEuropeFijiFranceGermanyGhanaGreeceGrenadaGuatemalaGuyanaHaitiHondurasHong KongHungaryIndiaIndonesiaIranIraqIrelandIsraelItalyJamaicaJapanJordanKazakhstanKenyaKoreaKuwaitLaosLatin AmericaLatviaLebanonLiberiaLithuaniaMalaysiaMexicoMicronesiaMiddle AfricaMoldovaMoroccoNepalNetherlandsNicaraguaNigeriaNorth AmericaNorth MacedoniaNorthern AfricaNorthern EuropeNorwayOceaniaPakistanPanamaPeruPhilippinesPolandPortugalRomaniaRussiaSaudi ArabiaScotlandSenegalSerbiaSierra LeoneSingaporeSomaliaSouth AfricaSouth AmericaSouth Central AsiaSouth Eastern AsiaSouthern EuropeSpainSri LankaSt. Vincent and the GrenadinesSudanSwedenSwitzerlandSyriaTaiwanThailandTrinidad and TobagoTurkeyUgandaUkraineUruguayUzbekistanVenezuelaVietnamWest IndiesWestern AfricaWestern AsiaWestern EuropeYemenZaireZimbabweAzores
1st Grade
Income
Poverty
Unemployment
Labor Participation
Family Structure
Vehicle Availability
Education Level
Disability

1st Grade Comparison

Immigrants from Bosnia and Herzegovina

Apache

Average
Good
97.9%
1ST GRADE
46.6/ 100
METRIC RATING
180th/ 347
METRIC RANK
98.0%
1ST GRADE
75.2/ 100
METRIC RATING
148th/ 347
METRIC RANK

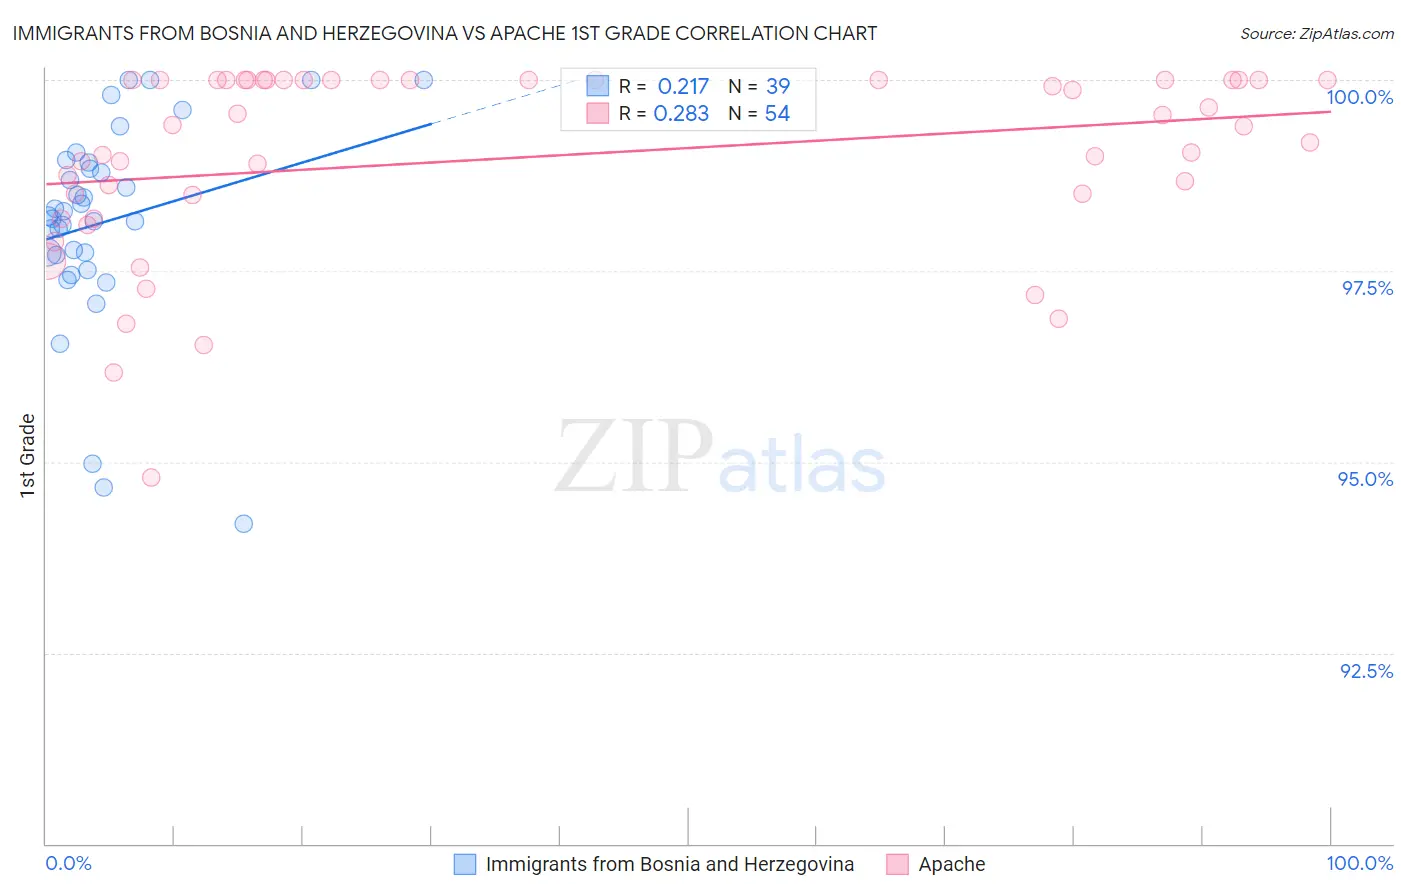
Immigrants from Bosnia and Herzegovina vs Apache 1st Grade Correlation Chart

The statistical analysis conducted on geographies consisting of 156,779,463 people shows a weak positive correlation between the proportion of Immigrants from Bosnia and Herzegovina and percentage of population with at least 1st grade education in the United States with a correlation coefficient (R) of 0.217 and weighted average of 97.9%. Similarly, the statistical analysis conducted on geographies consisting of 231,142,814 people shows a weak positive correlation between the proportion of Apache and percentage of population with at least 1st grade education in the United States with a correlation coefficient (R) of 0.283 and weighted average of 98.0%, a difference of 0.10%.
Immigrants from Bosnia and Herzegovina vs Apache 1st Grade

1st Grade Correlation Summary

MeasurementImmigrants from Bosnia and HerzegovinaApache
Minimum94.2%94.8%
Maximum100.0%100.0%
Range5.8%5.2%
Mean98.1%99.0%
Median98.2%99.4%
Interquartile 25% (IQ1)97.7%98.5%
Interquartile 75% (IQ3)98.9%100.0%
Interquartile Range (IQR)1.2%1.5%
Standard Deviation (Sample)1.3%1.2%
Standard Deviation (Population)1.3%1.2%

Similar Demographics by 1st Grade

Demographics Similar to Immigrants from Bosnia and Herzegovina by 1st Grade

In terms of 1st grade, the demographic groups most similar to Immigrants from Bosnia and Herzegovina are Immigrants from Venezuela (97.9%, a difference of 0.0%), Argentinean (97.9%, a difference of 0.0%), Kenyan (97.9%, a difference of 0.010%), Native/Alaskan (97.9%, a difference of 0.010%), and Immigrants from Sri Lanka (97.9%, a difference of 0.010%).
DemographicsRating | Rank1st Grade
Kenyans
51.2
/100
|
#173
Average
97.9%
Natives/Alaskans
50.0
/100
|
#174
Average
97.9%
Immigrants | Sri Lanka
49.7
/100
|
#175
Average
97.9%
Albanians
49.6
/100
|
#176
Average
97.9%
Immigrants | Brazil
49.1
/100
|
#177
Average
97.9%
Immigrants | Venezuela
47.8
/100
|
#178
Average
97.9%
Argentineans
47.2
/100
|
#179
Average
97.9%
Immigrants | Bosnia and Herzegovina
46.6
/100
|
#180
Average
97.9%
Portuguese
44.2
/100
|
#181
Average
97.9%
Egyptians
42.7
/100
|
#182
Average
97.9%
Immigrants | Argentina
41.3
/100
|
#183
Average
97.9%
Immigrants | Poland
40.1
/100
|
#184
Average
97.9%
Immigrants | Belarus
39.3
/100
|
#185
Fair
97.9%
Paiute
36.5
/100
|
#186
Fair
97.9%
Pakistanis
35.8
/100
|
#187
Fair
97.9%

Demographics Similar to Apache by 1st Grade

In terms of 1st grade, the demographic groups most similar to Apache are Immigrants from Greece (98.0%, a difference of 0.0%), Immigrants from Israel (98.0%, a difference of 0.010%), Filipino (98.0%, a difference of 0.010%), Jordanian (98.0%, a difference of 0.010%), and Hmong (98.0%, a difference of 0.020%).
DemographicsRating | Rank1st Grade
Immigrants | Turkey
82.8
/100
|
#141
Excellent
98.0%
Marshallese
82.0
/100
|
#142
Excellent
98.0%
Burmese
81.0
/100
|
#143
Excellent
98.0%
Alsatians
80.9
/100
|
#144
Excellent
98.0%
Hmong
79.0
/100
|
#145
Good
98.0%
Immigrants | Israel
77.8
/100
|
#146
Good
98.0%
Filipinos
77.6
/100
|
#147
Good
98.0%
Apache
75.2
/100
|
#148
Good
98.0%
Immigrants | Greece
74.9
/100
|
#149
Good
98.0%
Jordanians
72.7
/100
|
#150
Good
98.0%
Dutch West Indians
69.8
/100
|
#151
Good
98.0%
Immigrants | Moldova
69.5
/100
|
#152
Good
98.0%
Soviet Union
68.9
/100
|
#153
Good
98.0%
Immigrants | Iran
66.9
/100
|
#154
Good
98.0%
Comanche
66.9
/100
|
#155
Good
98.0%