Immigrants from Belize vs Immigrants from Nepal Master's Degree
COMPARE
Immigrants from Belize
Immigrants from Nepal
Master's Degree
Master's Degree Comparison
Immigrants from Belize
Immigrants from Nepal
12.1%
MASTER'S DEGREE
0.2/ 100
METRIC RATING
279th/ 347
METRIC RANK
17.0%
MASTER'S DEGREE
98.6/ 100
METRIC RATING
101st/ 347
METRIC RANK
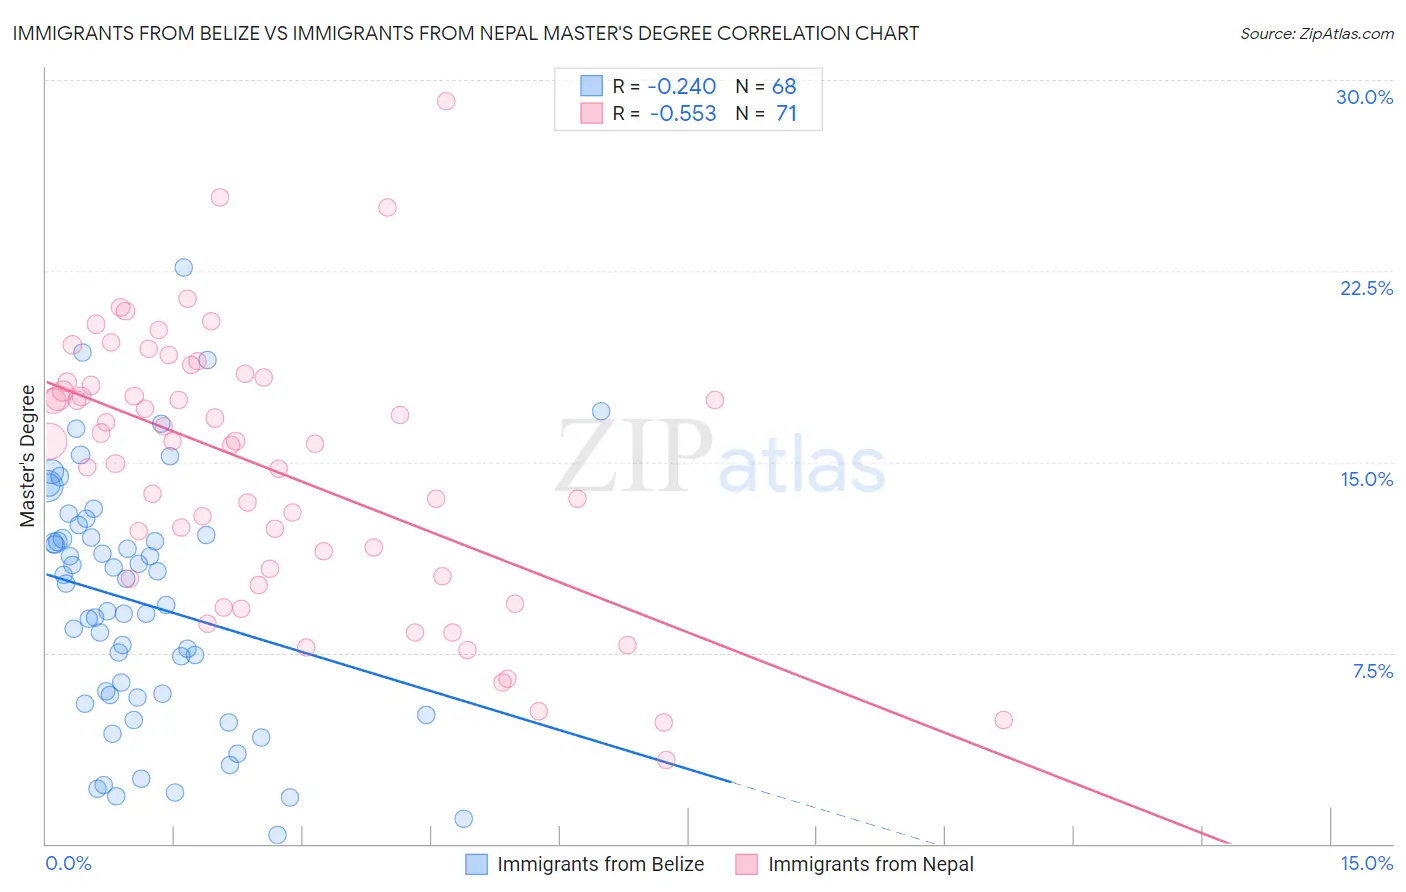
Immigrants from Belize vs Immigrants from Nepal Master's Degree Correlation Chart
The statistical analysis conducted on geographies consisting of 130,312,912 people shows a weak negative correlation between the proportion of Immigrants from Belize and percentage of population with at least master's degree education in the United States with a correlation coefficient (R) of -0.240 and weighted average of 12.1%. Similarly, the statistical analysis conducted on geographies consisting of 186,748,822 people shows a substantial negative correlation between the proportion of Immigrants from Nepal and percentage of population with at least master's degree education in the United States with a correlation coefficient (R) of -0.553 and weighted average of 17.0%, a difference of 40.6%.
Master's Degree Correlation Summary
| Measurement | Immigrants from Belize | Immigrants from Nepal |
| Minimum | 0.37% | 3.3% |
| Maximum | 22.6% | 29.2% |
| Range | 22.3% | 25.9% |
| Mean | 9.4% | 14.7% |
| Median | 9.8% | 15.8% |
| Interquartile 25% (IQ1) | 5.8% | 10.5% |
| Interquartile 75% (IQ3) | 12.1% | 18.1% |
| Interquartile Range (IQR) | 6.3% | 7.6% |
| Standard Deviation (Sample) | 4.8% | 5.3% |
| Standard Deviation (Population) | 4.8% | 5.2% |
Similar Demographics by Master's Degree
Demographics Similar to Immigrants from Belize by Master's Degree
In terms of master's degree, the demographic groups most similar to Immigrants from Belize are Immigrants from Dominican Republic (12.1%, a difference of 0.060%), Immigrants from Caribbean (12.1%, a difference of 0.080%), Potawatomi (12.1%, a difference of 0.080%), Black/African American (12.1%, a difference of 0.090%), and Cuban (12.1%, a difference of 0.15%).
| Demographics | Rating | Rank | Master's Degree |
| Comanche | 0.3 /100 | #272 | Tragic 12.1% |
| Blackfeet | 0.3 /100 | #273 | Tragic 12.1% |
| Cape Verdeans | 0.3 /100 | #274 | Tragic 12.1% |
| Cubans | 0.3 /100 | #275 | Tragic 12.1% |
| Blacks/African Americans | 0.3 /100 | #276 | Tragic 12.1% |
| Immigrants | Caribbean | 0.3 /100 | #277 | Tragic 12.1% |
| Potawatomi | 0.3 /100 | #278 | Tragic 12.1% |
| Immigrants | Belize | 0.2 /100 | #279 | Tragic 12.1% |
| Immigrants | Dominican Republic | 0.2 /100 | #280 | Tragic 12.1% |
| Malaysians | 0.2 /100 | #281 | Tragic 12.0% |
| Immigrants | El Salvador | 0.2 /100 | #282 | Tragic 12.0% |
| Hondurans | 0.2 /100 | #283 | Tragic 11.9% |
| Ottawa | 0.2 /100 | #284 | Tragic 11.9% |
| Immigrants | Nicaragua | 0.2 /100 | #285 | Tragic 11.8% |
| Aleuts | 0.1 /100 | #286 | Tragic 11.8% |
Demographics Similar to Immigrants from Nepal by Master's Degree
In terms of master's degree, the demographic groups most similar to Immigrants from Nepal are Chilean (16.9%, a difference of 0.080%), Albanian (17.0%, a difference of 0.18%), Laotian (17.0%, a difference of 0.39%), Alsatian (16.9%, a difference of 0.41%), and Immigrants from Ukraine (17.0%, a difference of 0.45%).
| Demographics | Rating | Rank | Master's Degree |
| Ugandans | 99.0 /100 | #94 | Exceptional 17.1% |
| Immigrants | Morocco | 98.9 /100 | #95 | Exceptional 17.1% |
| Immigrants | Northern Africa | 98.9 /100 | #96 | Exceptional 17.1% |
| Immigrants | England | 98.8 /100 | #97 | Exceptional 17.0% |
| Immigrants | Ukraine | 98.8 /100 | #98 | Exceptional 17.0% |
| Laotians | 98.8 /100 | #99 | Exceptional 17.0% |
| Albanians | 98.7 /100 | #100 | Exceptional 17.0% |
| Immigrants | Nepal | 98.6 /100 | #101 | Exceptional 17.0% |
| Chileans | 98.6 /100 | #102 | Exceptional 16.9% |
| Alsatians | 98.4 /100 | #103 | Exceptional 16.9% |
| Ukrainians | 98.3 /100 | #104 | Exceptional 16.9% |
| Syrians | 98.3 /100 | #105 | Exceptional 16.8% |
| Immigrants | Albania | 98.1 /100 | #106 | Exceptional 16.8% |
| Armenians | 98.0 /100 | #107 | Exceptional 16.8% |
| Sierra Leoneans | 98.0 /100 | #108 | Exceptional 16.8% |