Immigrants from Belize vs Celtic 8th Grade

COMPARE

Immigrants from Belize
Race
Ancestry
AfghanAfricanAlaska NativeAlaskan AthabascanAlbanianAleutAlsatianAmericanApacheArabArapahoArgentineanArmenianAssyrian/Chaldean/SyriacAustralianAustrianBahamianBangladeshiBarbadianBasqueBelgianBelizeanBermudanBhutaneseBlackfeetBolivianBrazilianBritishBritish West IndianBulgarianBurmeseCajunCambodianCanadianCape VerdeanCarpatho RusynCentral AmericanCentral American IndianCherokeeCheyenneChickasawChileanChineseChippewaChoctawColombianColvilleComancheCosta RicanCreeCreekCroatianCrowCubanCypriotCzechCzechoslovakianDanishDelawareDominicanDutchDutch West IndianEastern EuropeanEcuadorianEgyptianEnglishEstonianEthiopianEuropeanFijianFilipinoFinnishFrenchFrench American IndianFrench CanadianGermanGerman RussianGhanaianGreekGuamanian/ChamorroGuatemalanGuyaneseHaitianHmongHonduranHopiHoumaHungarianIcelanderIndian (Asian)IndonesianInupiatIranianIraqiIrishIroquoisIsraeliItalianJamaicanJapaneseJordanianKenyanKiowaKoreanLaotianLatvianLebaneseLiberianLithuanianLumbeeLuxembourgerMacedonianMalaysianMalteseMarshalleseMenomineeMexicanMexican American IndianMongolianMoroccanNative HawaiianNavajoNepaleseNew ZealanderNicaraguanNigerianNorthern EuropeanNorwegianOkinawanOsageOttawaPaiutePakistaniPalestinianPanamanianParaguayanPennsylvania GermanPeruvianPimaPolishPortuguesePotawatomiPuebloPuerto RicanPuget Sound SalishRomanianRussianSalvadoranSamoanScandinavianScotch-IrishScottishSeminoleSenegaleseSerbianShoshoneSierra LeoneanSiouxSlavicSlovakSloveneSomaliSouth AfricanSouth AmericanSouth American IndianSoviet UnionSpaniardSpanishSpanish AmericanSpanish American IndianSri LankanSubsaharan AfricanSudaneseSwedishSwissSyrianTaiwaneseThaiTlingit-HaidaTohono O'OdhamTonganTrinidadian and TobagonianTsimshianTurkishU.S. Virgin IslanderUgandanUkrainianUruguayanUteVenezuelanVietnameseWelshWest IndianYakamaYaquiYugoslavianYumanYup'ikZimbabwean
Immigration
NonimmigrantsImmigrantsAfghanistanAfricaAlbaniaArgentinaArmeniaAsiaAustraliaAustriaBahamasBangladeshBarbadosBelarusBelgiumBelizeBoliviaBosnia and HerzegovinaBrazilBulgariaBurma/MyanmarCabo VerdeCambodiaCameroonCanadaCaribbeanCentral AmericaChileChinaColombiaCongoCosta RicaCroatiaCubaCzechoslovakiaDenmarkDominicaDominican RepublicEastern AfricaEastern AsiaEastern EuropeEcuadorEgyptEl SalvadorEnglandEritreaEthiopiaEuropeFijiFranceGermanyGhanaGreeceGrenadaGuatemalaGuyanaHaitiHondurasHong KongHungaryIndiaIndonesiaIranIraqIrelandIsraelItalyJamaicaJapanJordanKazakhstanKenyaKoreaKuwaitLaosLatin AmericaLatviaLebanonLiberiaLithuaniaMalaysiaMexicoMicronesiaMiddle AfricaMoldovaMoroccoNepalNetherlandsNicaraguaNigeriaNorth AmericaNorth MacedoniaNorthern AfricaNorthern EuropeNorwayOceaniaPakistanPanamaPeruPhilippinesPolandPortugalRomaniaRussiaSaudi ArabiaScotlandSenegalSerbiaSierra LeoneSingaporeSomaliaSouth AfricaSouth AmericaSouth Central AsiaSouth Eastern AsiaSouthern EuropeSpainSri LankaSt. Vincent and the GrenadinesSudanSwedenSwitzerlandSyriaTaiwanThailandTrinidad and TobagoTurkeyUgandaUkraineUruguayUzbekistanVenezuelaVietnamWest IndiesWestern AfricaWestern AsiaWestern EuropeYemenZaireZimbabweAzores
Celtic
Race
Ancestry
AfghanAfricanAlaska NativeAlaskan AthabascanAlbanianAleutAlsatianAmericanApacheArabArapahoArgentineanArmenianAssyrian/Chaldean/SyriacAustralianAustrianBahamianBangladeshiBarbadianBasqueBelgianBelizeanBermudanBhutaneseBlackfeetBolivianBrazilianBritishBritish West IndianBulgarianBurmeseCajunCambodianCanadianCape VerdeanCarpatho RusynCelticCentral AmericanCentral American IndianCherokeeCheyenneChickasawChileanChineseChippewaChoctawColombianColvilleComancheCosta RicanCreeCreekCroatianCrowCubanCypriotCzechCzechoslovakianDanishDelawareDominicanDutchDutch West IndianEastern EuropeanEcuadorianEgyptianEnglishEstonianEthiopianEuropeanFijianFilipinoFinnishFrenchFrench American IndianFrench CanadianGermanGerman RussianGhanaianGreekGuamanian/ChamorroGuatemalanGuyaneseHaitianHmongHonduranHopiHoumaHungarianIcelanderIndian (Asian)IndonesianInupiatIranianIraqiIrishIroquoisIsraeliItalianJamaicanJapaneseJordanianKenyanKiowaKoreanLaotianLatvianLebaneseLiberianLithuanianLumbeeLuxembourgerMacedonianMalaysianMalteseMarshalleseMenomineeMexicanMexican American IndianMongolianMoroccanNative HawaiianNavajoNepaleseNew ZealanderNicaraguanNigerianNorthern EuropeanNorwegianOkinawanOsageOttawaPaiutePakistaniPalestinianPanamanianParaguayanPennsylvania GermanPeruvianPimaPolishPortuguesePotawatomiPuebloPuerto RicanPuget Sound SalishRomanianRussianSalvadoranSamoanScandinavianScotch-IrishScottishSeminoleSenegaleseSerbianShoshoneSierra LeoneanSiouxSlavicSlovakSloveneSomaliSouth AfricanSouth AmericanSouth American IndianSoviet UnionSpaniardSpanishSpanish AmericanSpanish American IndianSri LankanSubsaharan AfricanSudaneseSwedishSwissSyrianTaiwaneseThaiTlingit-HaidaTohono O'OdhamTonganTrinidadian and TobagonianTsimshianTurkishU.S. Virgin IslanderUgandanUkrainianUruguayanUteVenezuelanVietnameseWelshWest IndianYakamaYaquiYugoslavianYumanYup'ikZimbabwean
Immigration
NonimmigrantsImmigrantsAfghanistanAfricaAlbaniaArgentinaArmeniaAsiaAustraliaAustriaBahamasBangladeshBarbadosBelarusBelgiumBoliviaBosnia and HerzegovinaBrazilBulgariaBurma/MyanmarCabo VerdeCambodiaCameroonCanadaCaribbeanCentral AmericaChileChinaColombiaCongoCosta RicaCroatiaCubaCzechoslovakiaDenmarkDominicaDominican RepublicEastern AfricaEastern AsiaEastern EuropeEcuadorEgyptEl SalvadorEnglandEritreaEthiopiaEuropeFijiFranceGermanyGhanaGreeceGrenadaGuatemalaGuyanaHaitiHondurasHong KongHungaryIndiaIndonesiaIranIraqIrelandIsraelItalyJamaicaJapanJordanKazakhstanKenyaKoreaKuwaitLaosLatin AmericaLatviaLebanonLiberiaLithuaniaMalaysiaMexicoMicronesiaMiddle AfricaMoldovaMoroccoNepalNetherlandsNicaraguaNigeriaNorth AmericaNorth MacedoniaNorthern AfricaNorthern EuropeNorwayOceaniaPakistanPanamaPeruPhilippinesPolandPortugalRomaniaRussiaSaudi ArabiaScotlandSenegalSerbiaSierra LeoneSingaporeSomaliaSouth AfricaSouth AmericaSouth Central AsiaSouth Eastern AsiaSouthern EuropeSpainSri LankaSt. Vincent and the GrenadinesSudanSwedenSwitzerlandSyriaTaiwanThailandTrinidad and TobagoTurkeyUgandaUkraineUruguayUzbekistanVenezuelaVietnamWest IndiesWestern AfricaWestern AsiaWestern EuropeYemenZaireZimbabweAzores
8th Grade
Income
Poverty
Unemployment
Labor Participation
Family Structure
Vehicle Availability
Education Level
Disability

8th Grade Comparison

Immigrants from Belize

Celtics

Tragic
Exceptional
92.9%
8TH GRADE
0.0/ 100
METRIC RATING
323rd/ 347
METRIC RANK
96.8%
8TH GRADE
99.9/ 100
METRIC RATING
51st/ 347
METRIC RANK

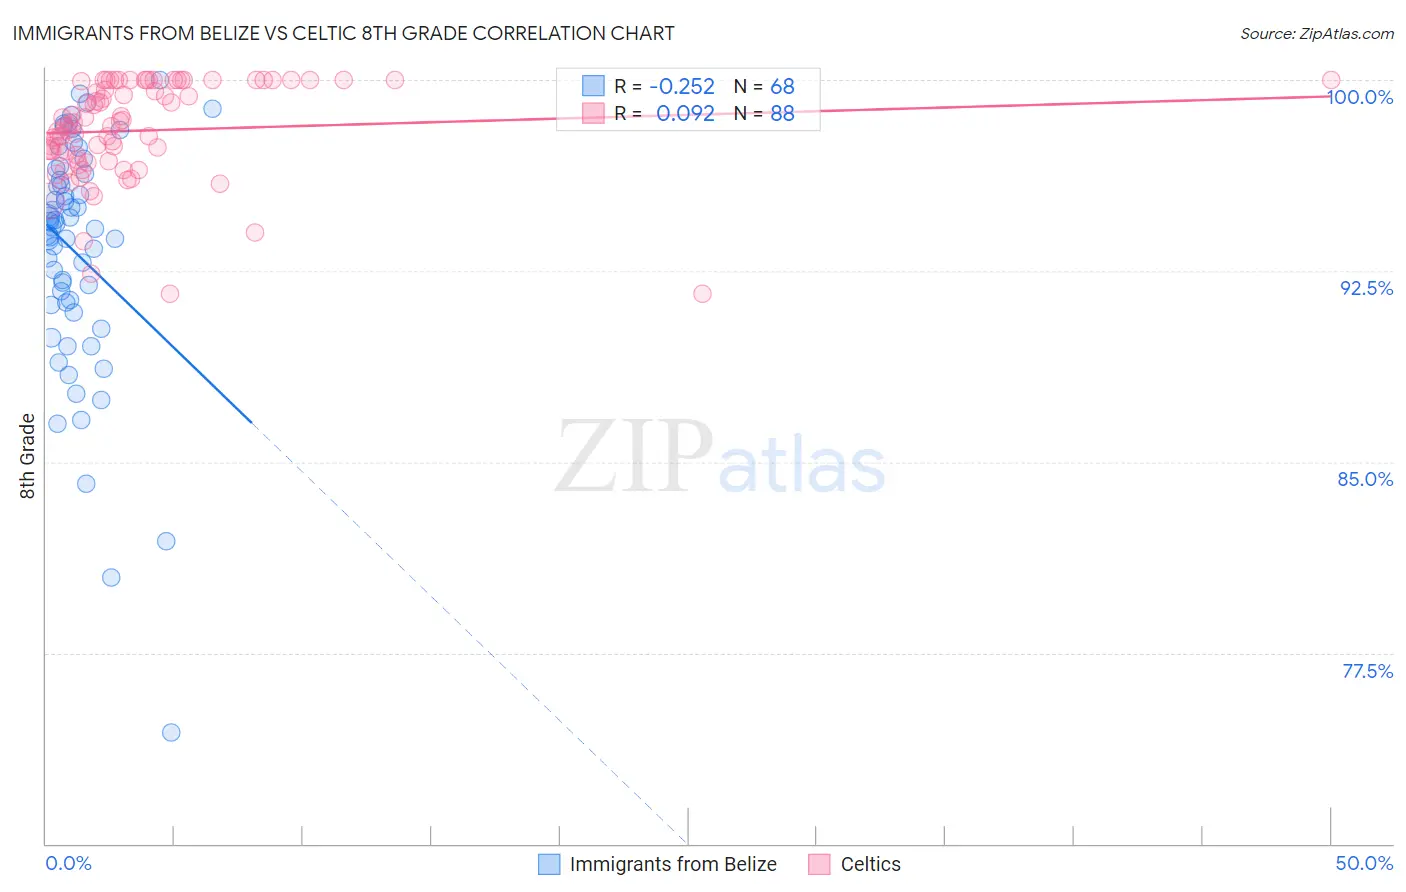
Immigrants from Belize vs Celtic 8th Grade Correlation Chart

The statistical analysis conducted on geographies consisting of 130,181,087 people shows a weak negative correlation between the proportion of Immigrants from Belize and percentage of population with at least 8th grade education in the United States with a correlation coefficient (R) of -0.252 and weighted average of 92.9%. Similarly, the statistical analysis conducted on geographies consisting of 168,876,981 people shows a slight positive correlation between the proportion of Celtics and percentage of population with at least 8th grade education in the United States with a correlation coefficient (R) of 0.092 and weighted average of 96.8%, a difference of 4.2%.
Immigrants from Belize vs Celtic 8th Grade

8th Grade Correlation Summary

MeasurementImmigrants from BelizeCeltic
Minimum74.3%91.6%
Maximum100.0%100.0%
Range25.7%8.4%
Mean93.2%98.0%
Median94.2%98.2%
Interquartile 25% (IQ1)91.2%96.9%
Interquartile 75% (IQ3)96.2%100.0%
Interquartile Range (IQR)5.0%3.1%
Standard Deviation (Sample)4.7%1.9%
Standard Deviation (Population)4.7%1.9%

Similar Demographics by 8th Grade

Demographics Similar to Immigrants from Belize by 8th Grade

In terms of 8th grade, the demographic groups most similar to Immigrants from Belize are Nicaraguan (93.0%, a difference of 0.050%), Nepalese (92.8%, a difference of 0.070%), Dominican (92.8%, a difference of 0.16%), Belizean (93.1%, a difference of 0.17%), and Central American Indian (92.7%, a difference of 0.21%).
DemographicsRating | Rank8th Grade
Immigrants | Cambodia
0.0
/100
|
#316
Tragic
93.3%
Immigrants | Ecuador
0.0
/100
|
#317
Tragic
93.3%
Puerto Ricans
0.0
/100
|
#318
Tragic
93.2%
Immigrants | Cuba
0.0
/100
|
#319
Tragic
93.2%
Immigrants | Fiji
0.0
/100
|
#320
Tragic
93.2%
Belizeans
0.0
/100
|
#321
Tragic
93.1%
Nicaraguans
0.0
/100
|
#322
Tragic
93.0%
Immigrants | Belize
0.0
/100
|
#323
Tragic
92.9%
Nepalese
0.0
/100
|
#324
Tragic
92.8%
Dominicans
0.0
/100
|
#325
Tragic
92.8%
Central American Indians
0.0
/100
|
#326
Tragic
92.7%
Immigrants | Azores
0.0
/100
|
#327
Tragic
92.5%
Immigrants | Nicaragua
0.0
/100
|
#328
Tragic
92.5%
Immigrants | Cabo Verde
0.0
/100
|
#329
Tragic
92.4%
Immigrants | Armenia
0.0
/100
|
#330
Tragic
92.3%

Demographics Similar to Celtics by 8th Grade

In terms of 8th grade, the demographic groups most similar to Celtics are Immigrants from Scotland (96.8%, a difference of 0.010%), Estonian (96.8%, a difference of 0.020%), Slavic (96.8%, a difference of 0.030%), Greek (96.8%, a difference of 0.030%), and Austrian (96.7%, a difference of 0.050%).
DemographicsRating | Rank8th Grade
Maltese
99.9
/100
|
#44
Exceptional
96.9%
Northern Europeans
99.9
/100
|
#45
Exceptional
96.9%
Czechoslovakians
99.9
/100
|
#46
Exceptional
96.9%
Bulgarians
99.9
/100
|
#47
Exceptional
96.9%
Slavs
99.9
/100
|
#48
Exceptional
96.8%
Estonians
99.9
/100
|
#49
Exceptional
96.8%
Immigrants | Scotland
99.9
/100
|
#50
Exceptional
96.8%
Celtics
99.9
/100
|
#51
Exceptional
96.8%
Greeks
99.9
/100
|
#52
Exceptional
96.8%
Austrians
99.9
/100
|
#53
Exceptional
96.7%
Serbians
99.8
/100
|
#54
Exceptional
96.7%
Russians
99.8
/100
|
#55
Exceptional
96.7%
Australians
99.8
/100
|
#56
Exceptional
96.7%
Macedonians
99.8
/100
|
#57
Exceptional
96.7%
Immigrants | Canada
99.8
/100
|
#58
Exceptional
96.7%