Immigrants from Belgium vs Sudanese Doctorate Degree
COMPARE
Immigrants from Belgium
Sudanese
Doctorate Degree
Doctorate Degree Comparison
Immigrants from Belgium
Sudanese
2.9%
DOCTORATE DEGREE
100.0/ 100
METRIC RATING
12th/ 347
METRIC RANK
2.1%
DOCTORATE DEGREE
97.7/ 100
METRIC RATING
106th/ 347
METRIC RANK
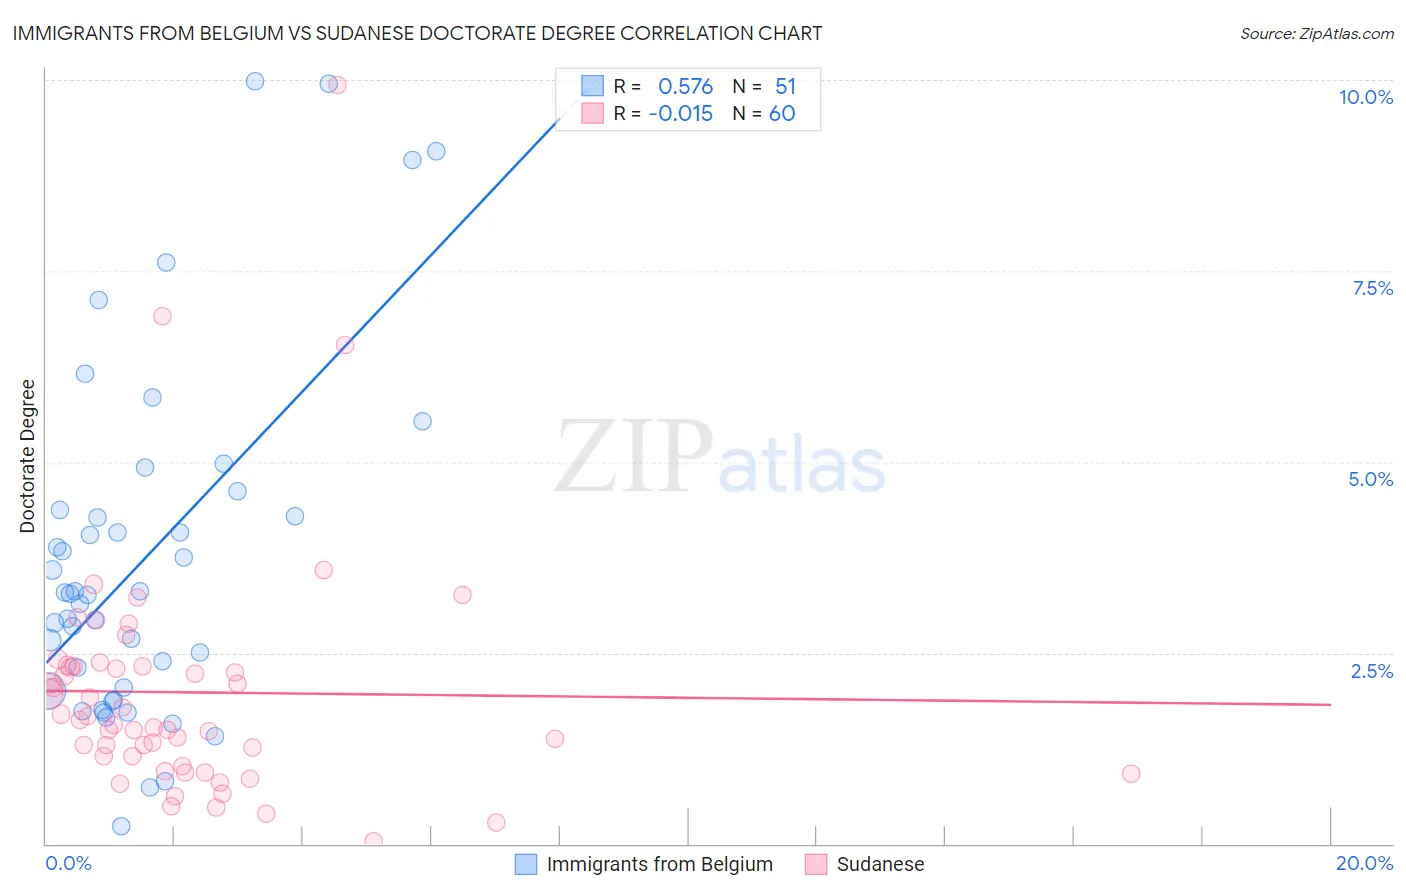
Immigrants from Belgium vs Sudanese Doctorate Degree Correlation Chart
The statistical analysis conducted on geographies consisting of 146,436,412 people shows a substantial positive correlation between the proportion of Immigrants from Belgium and percentage of population with at least doctorate degree education in the United States with a correlation coefficient (R) of 0.576 and weighted average of 2.9%. Similarly, the statistical analysis conducted on geographies consisting of 109,863,748 people shows no correlation between the proportion of Sudanese and percentage of population with at least doctorate degree education in the United States with a correlation coefficient (R) of -0.015 and weighted average of 2.1%, a difference of 38.2%.
Doctorate Degree Correlation Summary
| Measurement | Immigrants from Belgium | Sudanese |
| Minimum | 0.23% | 0.038% |
| Maximum | 10.0% | 9.9% |
| Range | 9.7% | 9.9% |
| Mean | 3.7% | 2.0% |
| Median | 3.3% | 1.6% |
| Interquartile 25% (IQ1) | 2.0% | 1.1% |
| Interquartile 75% (IQ3) | 4.4% | 2.3% |
| Interquartile Range (IQR) | 2.4% | 1.2% |
| Standard Deviation (Sample) | 2.3% | 1.6% |
| Standard Deviation (Population) | 2.3% | 1.6% |
Similar Demographics by Doctorate Degree
Demographics Similar to Immigrants from Belgium by Doctorate Degree
In terms of doctorate degree, the demographic groups most similar to Immigrants from Belgium are Indian (Asian) (2.9%, a difference of 0.66%), Immigrants from Sweden (2.9%, a difference of 0.94%), Immigrants from France (2.9%, a difference of 0.99%), Immigrants from India (2.8%, a difference of 2.1%), and Eastern European (2.8%, a difference of 2.5%).
| Demographics | Rating | Rank | Doctorate Degree |
| Iranians | 100.0 /100 | #5 | Exceptional 3.1% |
| Immigrants | Switzerland | 100.0 /100 | #6 | Exceptional 3.1% |
| Immigrants | China | 100.0 /100 | #7 | Exceptional 3.1% |
| Immigrants | Israel | 100.0 /100 | #8 | Exceptional 3.0% |
| Immigrants | Iran | 100.0 /100 | #9 | Exceptional 3.0% |
| Immigrants | Eastern Asia | 100.0 /100 | #10 | Exceptional 3.0% |
| Indians (Asian) | 100.0 /100 | #11 | Exceptional 2.9% |
| Immigrants | Belgium | 100.0 /100 | #12 | Exceptional 2.9% |
| Immigrants | Sweden | 100.0 /100 | #13 | Exceptional 2.9% |
| Immigrants | France | 100.0 /100 | #14 | Exceptional 2.9% |
| Immigrants | India | 100.0 /100 | #15 | Exceptional 2.8% |
| Eastern Europeans | 100.0 /100 | #16 | Exceptional 2.8% |
| Immigrants | Australia | 100.0 /100 | #17 | Exceptional 2.8% |
| Immigrants | Sri Lanka | 100.0 /100 | #18 | Exceptional 2.8% |
| Immigrants | Japan | 100.0 /100 | #19 | Exceptional 2.8% |
Demographics Similar to Sudanese by Doctorate Degree
In terms of doctorate degree, the demographic groups most similar to Sudanese are Arab (2.1%, a difference of 0.10%), European (2.1%, a difference of 0.39%), Austrian (2.1%, a difference of 0.45%), Romanian (2.1%, a difference of 0.57%), and Immigrants from Chile (2.1%, a difference of 0.58%).
| Demographics | Rating | Rank | Doctorate Degree |
| Immigrants | Egypt | 98.2 /100 | #99 | Exceptional 2.1% |
| Immigrants | Eastern Europe | 98.2 /100 | #100 | Exceptional 2.1% |
| Immigrants | Eastern Africa | 98.2 /100 | #101 | Exceptional 2.1% |
| Immigrants | Chile | 98.1 /100 | #102 | Exceptional 2.1% |
| Romanians | 98.1 /100 | #103 | Exceptional 2.1% |
| Austrians | 98.0 /100 | #104 | Exceptional 2.1% |
| Arabs | 97.8 /100 | #105 | Exceptional 2.1% |
| Sudanese | 97.7 /100 | #106 | Exceptional 2.1% |
| Europeans | 97.5 /100 | #107 | Exceptional 2.1% |
| Immigrants | Germany | 97.3 /100 | #108 | Exceptional 2.1% |
| Ukrainians | 97.2 /100 | #109 | Exceptional 2.1% |
| Brazilians | 97.2 /100 | #110 | Exceptional 2.1% |
| Immigrants | Pakistan | 97.1 /100 | #111 | Exceptional 2.1% |
| Syrians | 97.1 /100 | #112 | Exceptional 2.1% |
| Immigrants | Italy | 96.9 /100 | #113 | Exceptional 2.1% |