Immigrants from Belgium vs Palestinian 8th Grade

COMPARE

Immigrants from Belgium
Race
Ancestry
AfghanAfricanAlaska NativeAlaskan AthabascanAlbanianAleutAlsatianAmericanApacheArabArapahoArgentineanArmenianAssyrian/Chaldean/SyriacAustralianAustrianBahamianBangladeshiBarbadianBasqueBelgianBelizeanBermudanBhutaneseBlackfeetBolivianBrazilianBritishBritish West IndianBulgarianBurmeseCajunCambodianCanadianCape VerdeanCarpatho RusynCelticCentral AmericanCentral American IndianCherokeeCheyenneChickasawChileanChineseChippewaChoctawColombianColvilleComancheCosta RicanCreeCreekCroatianCrowCubanCypriotCzechCzechoslovakianDanishDelawareDominicanDutchDutch West IndianEastern EuropeanEcuadorianEgyptianEnglishEstonianEthiopianEuropeanFijianFilipinoFinnishFrenchFrench American IndianFrench CanadianGermanGerman RussianGhanaianGreekGuamanian/ChamorroGuatemalanGuyaneseHaitianHmongHonduranHopiHoumaHungarianIcelanderIndian (Asian)IndonesianInupiatIranianIraqiIrishIroquoisIsraeliItalianJamaicanJapaneseJordanianKenyanKiowaKoreanLaotianLatvianLebaneseLiberianLithuanianLumbeeLuxembourgerMacedonianMalaysianMalteseMarshalleseMenomineeMexicanMexican American IndianMongolianMoroccanNative HawaiianNavajoNepaleseNew ZealanderNicaraguanNigerianNorthern EuropeanNorwegianOkinawanOsageOttawaPaiutePakistaniPanamanianParaguayanPennsylvania GermanPeruvianPimaPolishPortuguesePotawatomiPuebloPuerto RicanPuget Sound SalishRomanianRussianSalvadoranSamoanScandinavianScotch-IrishScottishSeminoleSenegaleseSerbianShoshoneSierra LeoneanSiouxSlavicSlovakSloveneSomaliSouth AfricanSouth AmericanSouth American IndianSoviet UnionSpaniardSpanishSpanish AmericanSpanish American IndianSri LankanSubsaharan AfricanSudaneseSwedishSwissSyrianTaiwaneseThaiTlingit-HaidaTohono O'OdhamTonganTrinidadian and TobagonianTsimshianTurkishU.S. Virgin IslanderUgandanUkrainianUruguayanUteVenezuelanVietnameseWelshWest IndianYakamaYaquiYugoslavianYumanYup'ikZimbabwean
Immigration
NonimmigrantsImmigrantsAfghanistanAfricaAlbaniaArgentinaArmeniaAsiaAustraliaAustriaBahamasBangladeshBarbadosBelarusBelgiumBelizeBoliviaBosnia and HerzegovinaBrazilBulgariaBurma/MyanmarCabo VerdeCambodiaCameroonCanadaCaribbeanCentral AmericaChileChinaColombiaCongoCosta RicaCroatiaCubaCzechoslovakiaDenmarkDominicaDominican RepublicEastern AfricaEastern AsiaEastern EuropeEcuadorEgyptEl SalvadorEnglandEritreaEthiopiaEuropeFijiFranceGermanyGhanaGreeceGrenadaGuatemalaGuyanaHaitiHondurasHong KongHungaryIndiaIndonesiaIranIraqIrelandIsraelItalyJamaicaJapanJordanKazakhstanKenyaKoreaKuwaitLaosLatin AmericaLatviaLebanonLiberiaLithuaniaMalaysiaMexicoMicronesiaMiddle AfricaMoldovaMoroccoNepalNetherlandsNicaraguaNigeriaNorth AmericaNorth MacedoniaNorthern AfricaNorthern EuropeNorwayOceaniaPakistanPanamaPeruPhilippinesPolandPortugalRomaniaRussiaSaudi ArabiaScotlandSenegalSerbiaSierra LeoneSingaporeSomaliaSouth AfricaSouth AmericaSouth Central AsiaSouth Eastern AsiaSouthern EuropeSpainSri LankaSt. Vincent and the GrenadinesSudanSwedenSwitzerlandSyriaTaiwanThailandTrinidad and TobagoTurkeyUgandaUkraineUruguayUzbekistanVenezuelaVietnamWest IndiesWestern AfricaWestern AsiaWestern EuropeYemenZaireZimbabweAzores
Palestinian
Race
Ancestry
AfghanAfricanAlaska NativeAlaskan AthabascanAlbanianAleutAlsatianAmericanApacheArabArapahoArgentineanArmenianAssyrian/Chaldean/SyriacAustralianAustrianBahamianBangladeshiBarbadianBasqueBelgianBelizeanBermudanBhutaneseBlackfeetBolivianBrazilianBritishBritish West IndianBulgarianBurmeseCajunCambodianCanadianCape VerdeanCarpatho RusynCelticCentral AmericanCentral American IndianCherokeeCheyenneChickasawChileanChineseChippewaChoctawColombianColvilleComancheCosta RicanCreeCreekCroatianCrowCubanCypriotCzechCzechoslovakianDanishDelawareDominicanDutchDutch West IndianEastern EuropeanEcuadorianEgyptianEnglishEstonianEthiopianEuropeanFijianFilipinoFinnishFrenchFrench American IndianFrench CanadianGermanGerman RussianGhanaianGreekGuamanian/ChamorroGuatemalanGuyaneseHaitianHmongHonduranHopiHoumaHungarianIcelanderIndian (Asian)IndonesianInupiatIranianIraqiIrishIroquoisIsraeliItalianJamaicanJapaneseJordanianKenyanKiowaKoreanLaotianLatvianLebaneseLiberianLithuanianLumbeeLuxembourgerMacedonianMalaysianMalteseMarshalleseMenomineeMexicanMexican American IndianMongolianMoroccanNative HawaiianNavajoNepaleseNew ZealanderNicaraguanNigerianNorthern EuropeanNorwegianOkinawanOsageOttawaPaiutePakistaniPalestinianPanamanianParaguayanPennsylvania GermanPeruvianPimaPolishPortuguesePotawatomiPuebloPuerto RicanPuget Sound SalishRomanianRussianSalvadoranSamoanScandinavianScotch-IrishScottishSeminoleSenegaleseSerbianShoshoneSierra LeoneanSiouxSlavicSlovakSloveneSomaliSouth AfricanSouth AmericanSouth American IndianSoviet UnionSpaniardSpanishSpanish AmericanSpanish American IndianSri LankanSubsaharan AfricanSudaneseSwedishSwissSyrianTaiwaneseThaiTlingit-HaidaTohono O'OdhamTonganTrinidadian and TobagonianTsimshianTurkishU.S. Virgin IslanderUgandanUkrainianUruguayanUteVenezuelanVietnameseWelshWest IndianYakamaYaquiYugoslavianYumanYup'ikZimbabwean
Immigration
NonimmigrantsImmigrantsAfghanistanAfricaAlbaniaArgentinaArmeniaAsiaAustraliaAustriaBahamasBangladeshBarbadosBelarusBelizeBoliviaBosnia and HerzegovinaBrazilBulgariaBurma/MyanmarCabo VerdeCambodiaCameroonCanadaCaribbeanCentral AmericaChileChinaColombiaCongoCosta RicaCroatiaCubaCzechoslovakiaDenmarkDominicaDominican RepublicEastern AfricaEastern AsiaEastern EuropeEcuadorEgyptEl SalvadorEnglandEritreaEthiopiaEuropeFijiFranceGermanyGhanaGreeceGrenadaGuatemalaGuyanaHaitiHondurasHong KongHungaryIndiaIndonesiaIranIraqIrelandIsraelItalyJamaicaJapanJordanKazakhstanKenyaKoreaKuwaitLaosLatin AmericaLatviaLebanonLiberiaLithuaniaMalaysiaMexicoMicronesiaMiddle AfricaMoldovaMoroccoNepalNetherlandsNicaraguaNigeriaNorth AmericaNorth MacedoniaNorthern AfricaNorthern EuropeNorwayOceaniaPakistanPanamaPeruPhilippinesPolandPortugalRomaniaRussiaSaudi ArabiaScotlandSenegalSerbiaSierra LeoneSingaporeSomaliaSouth AfricaSouth AmericaSouth Central AsiaSouth Eastern AsiaSouthern EuropeSpainSri LankaSt. Vincent and the GrenadinesSudanSwedenSwitzerlandSyriaTaiwanThailandTrinidad and TobagoTurkeyUgandaUkraineUruguayUzbekistanVenezuelaVietnamWest IndiesWestern AfricaWestern AsiaWestern EuropeYemenZaireZimbabweAzores
8th Grade
Income
Poverty
Unemployment
Labor Participation
Family Structure
Vehicle Availability
Education Level
Disability

8th Grade Comparison

Immigrants from Belgium

Palestinians

Exceptional
Exceptional
96.5%
8TH GRADE
99.1/ 100
METRIC RATING
84th/ 347
METRIC RANK
96.2%
8TH GRADE
94.6/ 100
METRIC RATING
124th/ 347
METRIC RANK

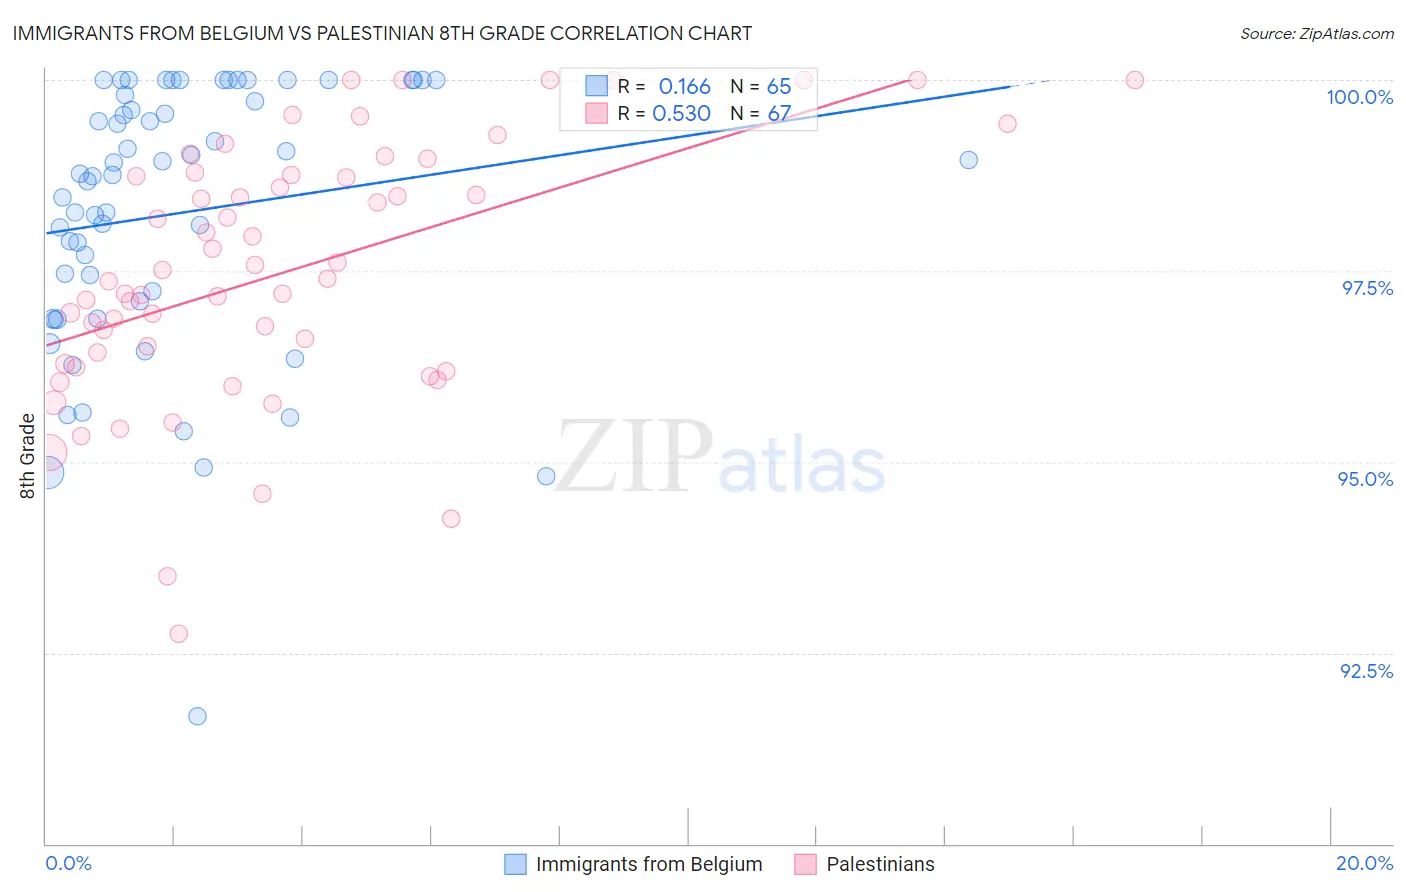
Immigrants from Belgium vs Palestinian 8th Grade Correlation Chart

The statistical analysis conducted on geographies consisting of 146,727,969 people shows a poor positive correlation between the proportion of Immigrants from Belgium and percentage of population with at least 8th grade education in the United States with a correlation coefficient (R) of 0.166 and weighted average of 96.5%. Similarly, the statistical analysis conducted on geographies consisting of 216,424,519 people shows a substantial positive correlation between the proportion of Palestinians and percentage of population with at least 8th grade education in the United States with a correlation coefficient (R) of 0.530 and weighted average of 96.2%, a difference of 0.30%.
Immigrants from Belgium vs Palestinian 8th Grade

8th Grade Correlation Summary

MeasurementImmigrants from BelgiumPalestinian
Minimum91.7%92.7%
Maximum100.0%100.0%
Range8.3%7.3%
Mean98.3%97.5%
Median98.8%97.4%
Interquartile 25% (IQ1)97.0%96.3%
Interquartile 75% (IQ3)99.9%98.8%
Interquartile Range (IQR)2.9%2.5%
Standard Deviation (Sample)1.8%1.7%
Standard Deviation (Population)1.8%1.7%

Similar Demographics by 8th Grade

Demographics Similar to Immigrants from Belgium by 8th Grade

In terms of 8th grade, the demographic groups most similar to Immigrants from Belgium are Icelander (96.5%, a difference of 0.010%), Immigrants from South Africa (96.5%, a difference of 0.010%), Cherokee (96.5%, a difference of 0.010%), Delaware (96.5%, a difference of 0.020%), and Romanian (96.5%, a difference of 0.020%).
DemographicsRating | Rank8th Grade
Cypriots
99.4
/100
|
#77
Exceptional
96.5%
Yugoslavians
99.4
/100
|
#78
Exceptional
96.5%
Puget Sound Salish
99.3
/100
|
#79
Exceptional
96.5%
Delaware
99.2
/100
|
#80
Exceptional
96.5%
Romanians
99.2
/100
|
#81
Exceptional
96.5%
Turks
99.2
/100
|
#82
Exceptional
96.5%
Icelanders
99.2
/100
|
#83
Exceptional
96.5%
Immigrants | Belgium
99.1
/100
|
#84
Exceptional
96.5%
Immigrants | South Africa
99.1
/100
|
#85
Exceptional
96.5%
Cherokee
99.0
/100
|
#86
Exceptional
96.5%
Immigrants | Australia
99.0
/100
|
#87
Exceptional
96.5%
Immigrants | Western Europe
99.0
/100
|
#88
Exceptional
96.4%
Chickasaw
98.9
/100
|
#89
Exceptional
96.4%
Immigrants | Sweden
98.9
/100
|
#90
Exceptional
96.4%
Thais
98.9
/100
|
#91
Exceptional
96.4%

Demographics Similar to Palestinians by 8th Grade

In terms of 8th grade, the demographic groups most similar to Palestinians are Filipino (96.2%, a difference of 0.0%), Immigrants from Romania (96.2%, a difference of 0.010%), Immigrants from Switzerland (96.2%, a difference of 0.020%), Immigrants from France (96.2%, a difference of 0.020%), and Immigrants from Bulgaria (96.2%, a difference of 0.020%).
DemographicsRating | Rank8th Grade
Immigrants | Croatia
96.0
/100
|
#117
Exceptional
96.2%
Immigrants | Norway
95.7
/100
|
#118
Exceptional
96.2%
Immigrants | Switzerland
95.3
/100
|
#119
Exceptional
96.2%
Immigrants | France
95.3
/100
|
#120
Exceptional
96.2%
Immigrants | Bulgaria
95.3
/100
|
#121
Exceptional
96.2%
Immigrants | Europe
95.3
/100
|
#122
Exceptional
96.2%
Filipinos
94.6
/100
|
#123
Exceptional
96.2%
Palestinians
94.6
/100
|
#124
Exceptional
96.2%
Immigrants | Romania
94.1
/100
|
#125
Exceptional
96.2%
Choctaw
94.0
/100
|
#126
Exceptional
96.2%
Immigrants | Serbia
94.0
/100
|
#127
Exceptional
96.2%
Immigrants | Bosnia and Herzegovina
93.9
/100
|
#128
Exceptional
96.2%
Cheyenne
93.3
/100
|
#129
Exceptional
96.1%
Soviet Union
92.6
/100
|
#130
Exceptional
96.1%
Pueblo
92.3
/100
|
#131
Exceptional
96.1%