Immigrants from Belgium vs Immigrants from Syria 1st Grade
COMPARE
Immigrants from Belgium
Immigrants from Syria
1st Grade
1st Grade Comparison
Immigrants from Belgium
Immigrants from Syria
98.3%
1ST GRADE
99.2/ 100
METRIC RATING
78th/ 347
METRIC RANK
97.7%
1ST GRADE
4.2/ 100
METRIC RATING
222nd/ 347
METRIC RANK
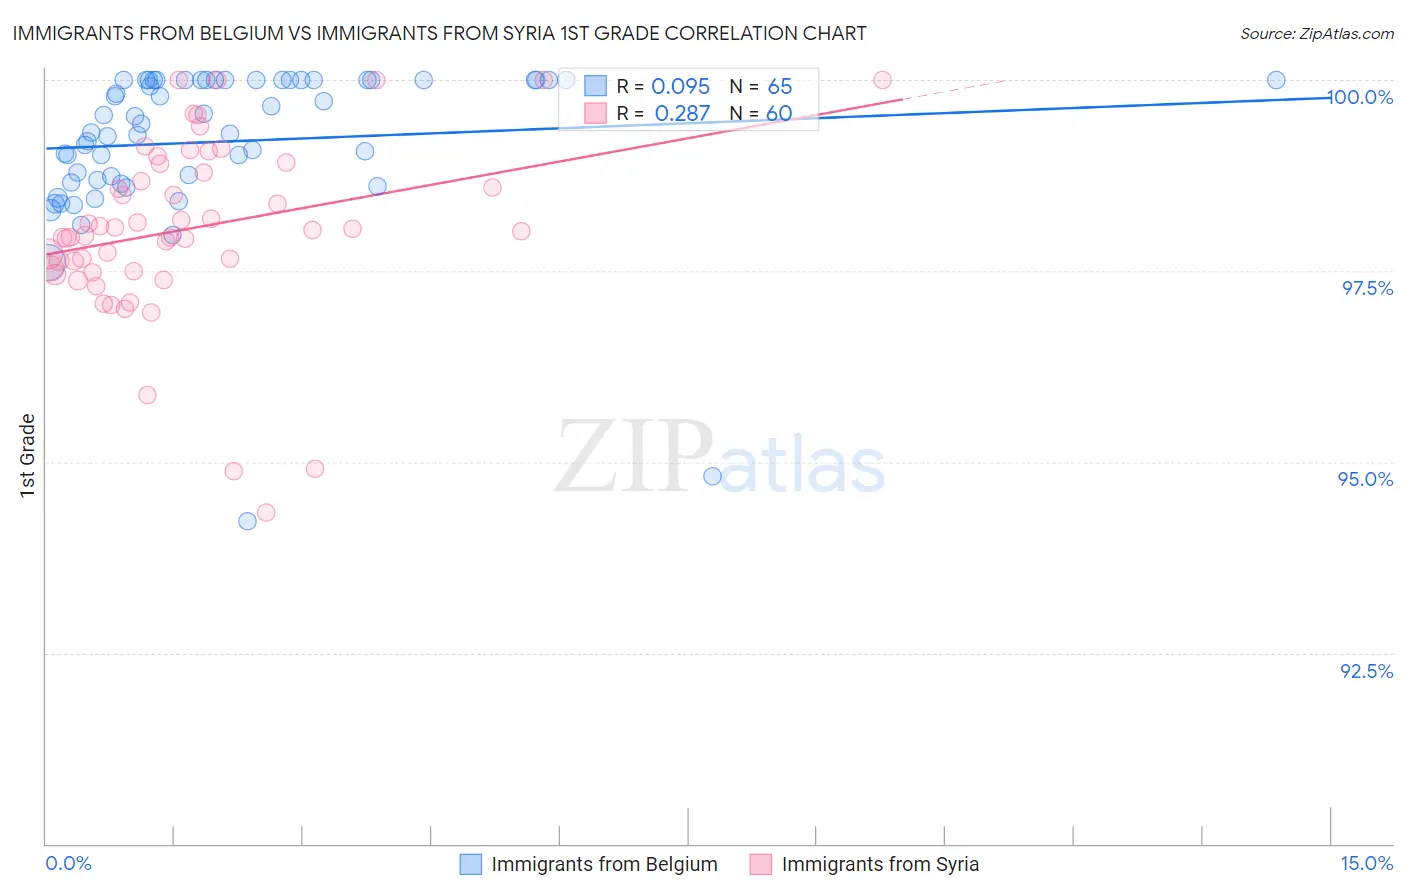
Immigrants from Belgium vs Immigrants from Syria 1st Grade Correlation Chart
The statistical analysis conducted on geographies consisting of 146,727,969 people shows a slight positive correlation between the proportion of Immigrants from Belgium and percentage of population with at least 1st grade education in the United States with a correlation coefficient (R) of 0.095 and weighted average of 98.3%. Similarly, the statistical analysis conducted on geographies consisting of 174,108,374 people shows a weak positive correlation between the proportion of Immigrants from Syria and percentage of population with at least 1st grade education in the United States with a correlation coefficient (R) of 0.287 and weighted average of 97.7%, a difference of 0.62%.
1st Grade Correlation Summary
| Measurement | Immigrants from Belgium | Immigrants from Syria |
| Minimum | 94.2% | 94.3% |
| Maximum | 100.0% | 100.0% |
| Range | 5.8% | 5.7% |
| Mean | 99.2% | 98.1% |
| Median | 99.4% | 98.0% |
| Interquartile 25% (IQ1) | 98.7% | 97.5% |
| Interquartile 75% (IQ3) | 100.0% | 98.8% |
| Interquartile Range (IQR) | 1.3% | 1.3% |
| Standard Deviation (Sample) | 1.1% | 1.2% |
| Standard Deviation (Population) | 1.1% | 1.2% |
Similar Demographics by 1st Grade
Demographics Similar to Immigrants from Belgium by 1st Grade
In terms of 1st grade, the demographic groups most similar to Immigrants from Belgium are Immigrants from Netherlands (98.3%, a difference of 0.010%), Cherokee (98.3%, a difference of 0.010%), Shoshone (98.3%, a difference of 0.010%), Immigrants from England (98.3%, a difference of 0.010%), and Immigrants from Lithuania (98.3%, a difference of 0.010%).
| Demographics | Rating | Rank | 1st Grade |
| Serbians | 99.6 /100 | #71 | Exceptional 98.3% |
| Cheyenne | 99.6 /100 | #72 | Exceptional 98.3% |
| Cajuns | 99.5 /100 | #73 | Exceptional 98.3% |
| Immigrants | Netherlands | 99.4 /100 | #74 | Exceptional 98.3% |
| Cherokee | 99.3 /100 | #75 | Exceptional 98.3% |
| Shoshone | 99.3 /100 | #76 | Exceptional 98.3% |
| Immigrants | England | 99.3 /100 | #77 | Exceptional 98.3% |
| Immigrants | Belgium | 99.2 /100 | #78 | Exceptional 98.3% |
| Immigrants | Lithuania | 99.2 /100 | #79 | Exceptional 98.3% |
| Osage | 99.2 /100 | #80 | Exceptional 98.3% |
| Potawatomi | 99.1 /100 | #81 | Exceptional 98.3% |
| Icelanders | 99.1 /100 | #82 | Exceptional 98.3% |
| Immigrants | Sweden | 99.1 /100 | #83 | Exceptional 98.3% |
| Delaware | 99.1 /100 | #84 | Exceptional 98.3% |
| Hopi | 99.0 /100 | #85 | Exceptional 98.3% |
Demographics Similar to Immigrants from Syria by 1st Grade
In terms of 1st grade, the demographic groups most similar to Immigrants from Syria are Immigrants from Sudan (97.7%, a difference of 0.0%), Immigrants from Zaire (97.7%, a difference of 0.0%), Iraqi (97.7%, a difference of 0.0%), Immigrants from Nepal (97.7%, a difference of 0.0%), and Tongan (97.7%, a difference of 0.010%).
| Demographics | Rating | Rank | 1st Grade |
| Bahamians | 7.5 /100 | #215 | Tragic 97.7% |
| Uruguayans | 7.4 /100 | #216 | Tragic 97.7% |
| Samoans | 6.8 /100 | #217 | Tragic 97.7% |
| Immigrants | Morocco | 5.3 /100 | #218 | Tragic 97.7% |
| Immigrants | Panama | 5.2 /100 | #219 | Tragic 97.7% |
| Tongans | 4.6 /100 | #220 | Tragic 97.7% |
| Immigrants | Sudan | 4.3 /100 | #221 | Tragic 97.7% |
| Immigrants | Syria | 4.2 /100 | #222 | Tragic 97.7% |
| Immigrants | Zaire | 4.1 /100 | #223 | Tragic 97.7% |
| Iraqis | 4.0 /100 | #224 | Tragic 97.7% |
| Immigrants | Nepal | 4.0 /100 | #225 | Tragic 97.7% |
| Sudanese | 3.7 /100 | #226 | Tragic 97.7% |
| Sierra Leoneans | 3.6 /100 | #227 | Tragic 97.7% |
| Sub-Saharan Africans | 3.6 /100 | #228 | Tragic 97.7% |
| Immigrants | Costa Rica | 3.5 /100 | #229 | Tragic 97.7% |