Immigrants from Belarus vs Immigrants from the Azores 2nd Grade

COMPARE

Immigrants from Belarus
Race
Ancestry
AfghanAfricanAlaska NativeAlaskan AthabascanAlbanianAleutAlsatianAmericanApacheArabArapahoArgentineanArmenianAssyrian/Chaldean/SyriacAustralianAustrianBahamianBangladeshiBarbadianBasqueBelgianBelizeanBermudanBhutaneseBlackfeetBolivianBrazilianBritishBritish West IndianBulgarianBurmeseCajunCambodianCanadianCape VerdeanCarpatho RusynCelticCentral AmericanCentral American IndianCherokeeCheyenneChickasawChileanChineseChippewaChoctawColombianColvilleComancheCosta RicanCreeCreekCroatianCrowCubanCypriotCzechCzechoslovakianDanishDelawareDominicanDutchDutch West IndianEastern EuropeanEcuadorianEgyptianEnglishEstonianEthiopianEuropeanFijianFilipinoFinnishFrenchFrench American IndianFrench CanadianGermanGerman RussianGhanaianGreekGuamanian/ChamorroGuatemalanGuyaneseHaitianHmongHonduranHopiHoumaHungarianIcelanderIndian (Asian)IndonesianInupiatIranianIraqiIrishIroquoisIsraeliItalianJamaicanJapaneseJordanianKenyanKiowaKoreanLaotianLatvianLebaneseLiberianLithuanianLumbeeLuxembourgerMacedonianMalaysianMalteseMarshalleseMenomineeMexicanMexican American IndianMongolianMoroccanNative HawaiianNavajoNepaleseNew ZealanderNicaraguanNigerianNorthern EuropeanNorwegianOkinawanOsageOttawaPaiutePakistaniPalestinianPanamanianParaguayanPennsylvania GermanPeruvianPimaPolishPortuguesePotawatomiPuebloPuerto RicanPuget Sound SalishRomanianRussianSalvadoranSamoanScandinavianScotch-IrishScottishSeminoleSenegaleseSerbianShoshoneSierra LeoneanSiouxSlavicSlovakSloveneSomaliSouth AfricanSouth AmericanSouth American IndianSoviet UnionSpaniardSpanishSpanish AmericanSpanish American IndianSri LankanSubsaharan AfricanSudaneseSwedishSwissSyrianTaiwaneseThaiTlingit-HaidaTohono O'OdhamTonganTrinidadian and TobagonianTsimshianTurkishU.S. Virgin IslanderUgandanUkrainianUruguayanUteVenezuelanVietnameseWelshWest IndianYakamaYaquiYugoslavianYumanYup'ikZimbabwean
Immigration
NonimmigrantsImmigrantsAfghanistanAfricaAlbaniaArgentinaArmeniaAsiaAustraliaAustriaBahamasBangladeshBarbadosBelarusBelgiumBelizeBoliviaBosnia and HerzegovinaBrazilBulgariaBurma/MyanmarCabo VerdeCambodiaCameroonCanadaCaribbeanCentral AmericaChileChinaColombiaCongoCosta RicaCroatiaCubaCzechoslovakiaDenmarkDominicaDominican RepublicEastern AfricaEastern AsiaEastern EuropeEcuadorEgyptEl SalvadorEnglandEritreaEthiopiaEuropeFijiFranceGermanyGhanaGreeceGrenadaGuatemalaGuyanaHaitiHondurasHong KongHungaryIndiaIndonesiaIranIraqIrelandIsraelItalyJamaicaJapanJordanKazakhstanKenyaKoreaKuwaitLaosLatin AmericaLatviaLebanonLiberiaLithuaniaMalaysiaMexicoMicronesiaMiddle AfricaMoldovaMoroccoNepalNetherlandsNicaraguaNigeriaNorth AmericaNorth MacedoniaNorthern AfricaNorthern EuropeNorwayOceaniaPakistanPanamaPeruPhilippinesPolandPortugalRomaniaRussiaSaudi ArabiaScotlandSenegalSerbiaSierra LeoneSingaporeSomaliaSouth AfricaSouth AmericaSouth Central AsiaSouth Eastern AsiaSouthern EuropeSpainSri LankaSt. Vincent and the GrenadinesSudanSwedenSwitzerlandSyriaTaiwanThailandTrinidad and TobagoTurkeyUgandaUkraineUruguayUzbekistanVenezuelaVietnamWest IndiesWestern AfricaWestern AsiaWestern EuropeYemenZaireZimbabwe
Immigrants from the Azores
Race
Ancestry
AfghanAfricanAlaska NativeAlaskan AthabascanAlbanianAleutAlsatianAmericanApacheArabArapahoArgentineanArmenianAssyrian/Chaldean/SyriacAustralianAustrianBahamianBangladeshiBarbadianBasqueBelgianBelizeanBermudanBhutaneseBlackfeetBolivianBrazilianBritishBritish West IndianBulgarianBurmeseCajunCambodianCanadianCape VerdeanCarpatho RusynCelticCentral AmericanCentral American IndianCherokeeCheyenneChickasawChileanChineseChippewaChoctawColombianColvilleComancheCosta RicanCreeCreekCroatianCrowCubanCypriotCzechCzechoslovakianDanishDelawareDominicanDutchDutch West IndianEastern EuropeanEcuadorianEgyptianEnglishEstonianEthiopianEuropeanFijianFilipinoFinnishFrenchFrench American IndianFrench CanadianGermanGerman RussianGhanaianGreekGuamanian/ChamorroGuatemalanGuyaneseHaitianHmongHonduranHopiHoumaHungarianIcelanderIndian (Asian)IndonesianInupiatIranianIraqiIrishIroquoisIsraeliItalianJamaicanJapaneseJordanianKenyanKiowaKoreanLaotianLatvianLebaneseLiberianLithuanianLumbeeLuxembourgerMacedonianMalaysianMalteseMarshalleseMenomineeMexicanMexican American IndianMongolianMoroccanNative HawaiianNavajoNepaleseNew ZealanderNicaraguanNigerianNorthern EuropeanNorwegianOkinawanOsageOttawaPaiutePakistaniPalestinianPanamanianParaguayanPennsylvania GermanPeruvianPimaPolishPortuguesePotawatomiPuebloPuerto RicanPuget Sound SalishRomanianRussianSalvadoranSamoanScandinavianScotch-IrishScottishSeminoleSenegaleseSerbianShoshoneSierra LeoneanSiouxSlavicSlovakSloveneSomaliSouth AfricanSouth AmericanSouth American IndianSoviet UnionSpaniardSpanishSpanish AmericanSpanish American IndianSri LankanSubsaharan AfricanSudaneseSwedishSwissSyrianTaiwaneseThaiTlingit-HaidaTohono O'OdhamTonganTrinidadian and TobagonianTsimshianTurkishU.S. Virgin IslanderUgandanUkrainianUruguayanUteVenezuelanVietnameseWelshWest IndianYakamaYaquiYugoslavianYumanYup'ikZimbabwean
Immigration
NonimmigrantsImmigrantsAfghanistanAfricaAlbaniaArgentinaArmeniaAsiaAustraliaAustriaBahamasBangladeshBarbadosBelgiumBelizeBoliviaBosnia and HerzegovinaBrazilBulgariaBurma/MyanmarCabo VerdeCambodiaCameroonCanadaCaribbeanCentral AmericaChileChinaColombiaCongoCosta RicaCroatiaCubaCzechoslovakiaDenmarkDominicaDominican RepublicEastern AfricaEastern AsiaEastern EuropeEcuadorEgyptEl SalvadorEnglandEritreaEthiopiaEuropeFijiFranceGermanyGhanaGreeceGrenadaGuatemalaGuyanaHaitiHondurasHong KongHungaryIndiaIndonesiaIranIraqIrelandIsraelItalyJamaicaJapanJordanKazakhstanKenyaKoreaKuwaitLaosLatin AmericaLatviaLebanonLiberiaLithuaniaMalaysiaMexicoMicronesiaMiddle AfricaMoldovaMoroccoNepalNetherlandsNicaraguaNigeriaNorth AmericaNorth MacedoniaNorthern AfricaNorthern EuropeNorwayOceaniaPakistanPanamaPeruPhilippinesPolandPortugalRomaniaRussiaSaudi ArabiaScotlandSenegalSerbiaSierra LeoneSingaporeSomaliaSouth AfricaSouth AmericaSouth Central AsiaSouth Eastern AsiaSouthern EuropeSpainSri LankaSt. Vincent and the GrenadinesSudanSwedenSwitzerlandSyriaTaiwanThailandTrinidad and TobagoTurkeyUgandaUkraineUruguayUzbekistanVenezuelaVietnamWest IndiesWestern AfricaWestern AsiaWestern EuropeYemenZaireZimbabweAzores
2nd Grade
Income
Poverty
Unemployment
Labor Participation
Family Structure
Vehicle Availability
Education Level
Disability

2nd Grade Comparison

Immigrants from Belarus

Immigrants from the Azores

Average
Tragic
97.8%
2ND GRADE
41.5/ 100
METRIC RATING
184th/ 347
METRIC RANK
96.8%
2ND GRADE
0.0/ 100
METRIC RATING
307th/ 347
METRIC RANK

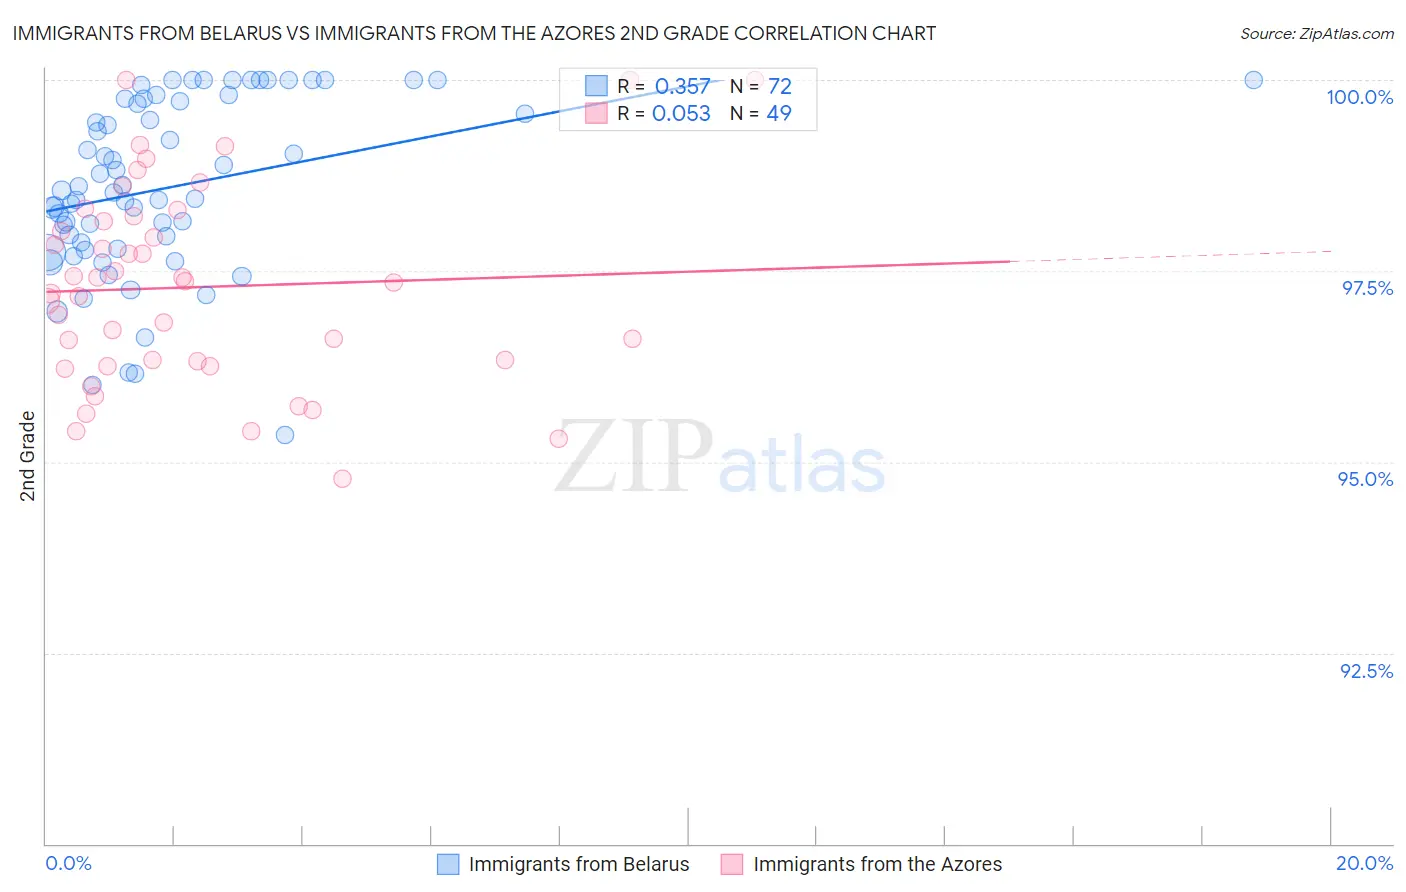
Immigrants from Belarus vs Immigrants from the Azores 2nd Grade Correlation Chart

The statistical analysis conducted on geographies consisting of 149,993,317 people shows a mild positive correlation between the proportion of Immigrants from Belarus and percentage of population with at least 2nd grade education in the United States with a correlation coefficient (R) of 0.357 and weighted average of 97.8%. Similarly, the statistical analysis conducted on geographies consisting of 46,257,310 people shows a slight positive correlation between the proportion of Immigrants from the Azores and percentage of population with at least 2nd grade education in the United States with a correlation coefficient (R) of 0.053 and weighted average of 96.8%, a difference of 1.0%.
Immigrants from Belarus vs Immigrants from the Azores 2nd Grade

2nd Grade Correlation Summary

MeasurementImmigrants from BelarusImmigrants from the Azores
Minimum95.4%94.8%
Maximum100.0%100.0%
Range4.6%5.2%
Mean98.6%97.3%
Median98.5%97.3%
Interquartile 25% (IQ1)97.8%96.3%
Interquartile 75% (IQ3)99.7%98.2%
Interquartile Range (IQR)1.9%1.9%
Standard Deviation (Sample)1.1%1.3%
Standard Deviation (Population)1.1%1.3%

Similar Demographics by 2nd Grade

Demographics Similar to Immigrants from Belarus by 2nd Grade

In terms of 2nd grade, the demographic groups most similar to Immigrants from Belarus are Portuguese (97.8%, a difference of 0.0%), Immigrants from Poland (97.8%, a difference of 0.0%), Immigrants from Argentina (97.8%, a difference of 0.0%), Immigrants from Venezuela (97.9%, a difference of 0.010%), and Native/Alaskan (97.9%, a difference of 0.010%).
DemographicsRating | Rank2nd Grade
Immigrants | Brazil
46.6
/100
|
#177
Average
97.9%
Argentineans
46.3
/100
|
#178
Average
97.9%
Immigrants | Venezuela
46.1
/100
|
#179
Average
97.9%
Natives/Alaskans
44.3
/100
|
#180
Average
97.9%
Egyptians
44.3
/100
|
#181
Average
97.9%
Portuguese
42.4
/100
|
#182
Average
97.8%
Immigrants | Poland
42.2
/100
|
#183
Average
97.8%
Immigrants | Belarus
41.5
/100
|
#184
Average
97.8%
Immigrants | Argentina
40.6
/100
|
#185
Average
97.8%
Arabs
36.9
/100
|
#186
Fair
97.8%
Pakistanis
36.1
/100
|
#187
Fair
97.8%
Immigrants | Kazakhstan
35.6
/100
|
#188
Fair
97.8%
Panamanians
33.5
/100
|
#189
Fair
97.8%
Immigrants | Taiwan
31.8
/100
|
#190
Fair
97.8%
Paraguayans
30.8
/100
|
#191
Fair
97.8%

Demographics Similar to Immigrants from the Azores by 2nd Grade

In terms of 2nd grade, the demographic groups most similar to Immigrants from the Azores are Immigrants from Haiti (96.8%, a difference of 0.010%), Belizean (96.8%, a difference of 0.010%), Sri Lankan (96.8%, a difference of 0.020%), Guyanese (96.8%, a difference of 0.020%), and Immigrants from Somalia (96.9%, a difference of 0.030%).
DemographicsRating | Rank2nd Grade
Immigrants | South Eastern Asia
0.0
/100
|
#300
Tragic
97.0%
Central American Indians
0.0
/100
|
#301
Tragic
97.0%
Somalis
0.0
/100
|
#302
Tragic
97.0%
Ecuadorians
0.0
/100
|
#303
Tragic
96.9%
Immigrants | Caribbean
0.0
/100
|
#304
Tragic
96.9%
Nicaraguans
0.0
/100
|
#305
Tragic
96.9%
Immigrants | Somalia
0.0
/100
|
#306
Tragic
96.9%
Immigrants | Azores
0.0
/100
|
#307
Tragic
96.8%
Immigrants | Haiti
0.0
/100
|
#308
Tragic
96.8%
Belizeans
0.0
/100
|
#309
Tragic
96.8%
Sri Lankans
0.0
/100
|
#310
Tragic
96.8%
Guyanese
0.0
/100
|
#311
Tragic
96.8%
Cape Verdeans
0.0
/100
|
#312
Tragic
96.8%
Hispanics or Latinos
0.0
/100
|
#313
Tragic
96.8%
Immigrants | Ecuador
0.0
/100
|
#314
Tragic
96.8%