Immigrants from Bangladesh vs Immigrants from Portugal 10th Grade
COMPARE
Immigrants from Bangladesh
Immigrants from Portugal
10th Grade
10th Grade Comparison
Immigrants from Bangladesh
Immigrants from Portugal
91.0%
10TH GRADE
0.0/ 100
METRIC RATING
308th/ 347
METRIC RANK
90.8%
10TH GRADE
0.0/ 100
METRIC RATING
312th/ 347
METRIC RANK
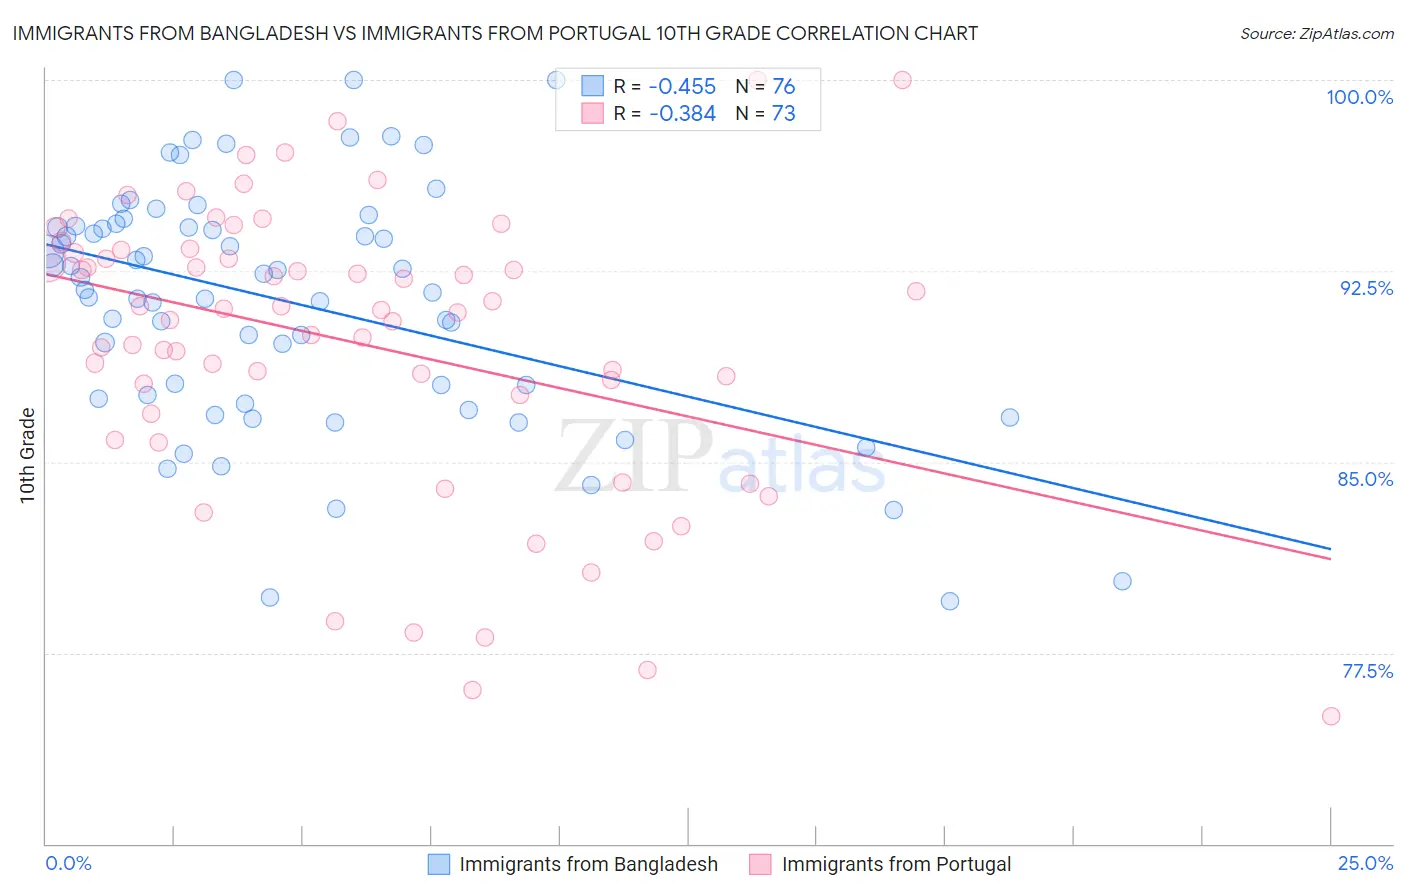
Immigrants from Bangladesh vs Immigrants from Portugal 10th Grade Correlation Chart
The statistical analysis conducted on geographies consisting of 203,672,706 people shows a moderate negative correlation between the proportion of Immigrants from Bangladesh and percentage of population with at least 10th grade education in the United States with a correlation coefficient (R) of -0.455 and weighted average of 91.0%. Similarly, the statistical analysis conducted on geographies consisting of 174,792,107 people shows a mild negative correlation between the proportion of Immigrants from Portugal and percentage of population with at least 10th grade education in the United States with a correlation coefficient (R) of -0.384 and weighted average of 90.8%, a difference of 0.26%.
10th Grade Correlation Summary
| Measurement | Immigrants from Bangladesh | Immigrants from Portugal |
| Minimum | 79.5% | 75.0% |
| Maximum | 100.0% | 100.0% |
| Range | 20.5% | 25.0% |
| Mean | 91.2% | 89.7% |
| Median | 92.0% | 91.0% |
| Interquartile 25% (IQ1) | 87.6% | 87.3% |
| Interquartile 75% (IQ3) | 94.2% | 93.3% |
| Interquartile Range (IQR) | 6.7% | 6.0% |
| Standard Deviation (Sample) | 4.7% | 5.6% |
| Standard Deviation (Population) | 4.7% | 5.6% |
Demographics Similar to Immigrants from Bangladesh and Immigrants from Portugal by 10th Grade
In terms of 10th grade, the demographic groups most similar to Immigrants from Bangladesh are Immigrants from Fiji (91.0%, a difference of 0.010%), Immigrants (91.0%, a difference of 0.040%), Yaqui (91.1%, a difference of 0.070%), Vietnamese (90.9%, a difference of 0.080%), and Immigrants from Cambodia (90.9%, a difference of 0.10%). Similarly, the demographic groups most similar to Immigrants from Portugal are Cape Verdean (90.8%, a difference of 0.030%), Nepalese (90.7%, a difference of 0.11%), Immigrants from Cambodia (90.9%, a difference of 0.16%), Vietnamese (90.9%, a difference of 0.19%), and Immigrants from Caribbean (90.6%, a difference of 0.19%).
| Demographics | Rating | Rank | 10th Grade |
| Guyanese | 0.0 /100 | #300 | Tragic 91.4% |
| Japanese | 0.0 /100 | #301 | Tragic 91.2% |
| Immigrants | Guyana | 0.0 /100 | #302 | Tragic 91.2% |
| Immigrants | Vietnam | 0.0 /100 | #303 | Tragic 91.2% |
| Pima | 0.0 /100 | #304 | Tragic 91.2% |
| Immigrants | Dominica | 0.0 /100 | #305 | Tragic 91.1% |
| Yaqui | 0.0 /100 | #306 | Tragic 91.1% |
| Immigrants | Fiji | 0.0 /100 | #307 | Tragic 91.0% |
| Immigrants | Bangladesh | 0.0 /100 | #308 | Tragic 91.0% |
| Immigrants | Immigrants | 0.0 /100 | #309 | Tragic 91.0% |
| Vietnamese | 0.0 /100 | #310 | Tragic 90.9% |
| Immigrants | Cambodia | 0.0 /100 | #311 | Tragic 90.9% |
| Immigrants | Portugal | 0.0 /100 | #312 | Tragic 90.8% |
| Cape Verdeans | 0.0 /100 | #313 | Tragic 90.8% |
| Nepalese | 0.0 /100 | #314 | Tragic 90.7% |
| Immigrants | Caribbean | 0.0 /100 | #315 | Tragic 90.6% |
| Ecuadorians | 0.0 /100 | #316 | Tragic 90.6% |
| Immigrants | Ecuador | 0.0 /100 | #317 | Tragic 90.4% |
| Immigrants | Cuba | 0.0 /100 | #318 | Tragic 90.2% |
| Nicaraguans | 0.0 /100 | #319 | Tragic 90.2% |
| Houma | 0.0 /100 | #320 | Tragic 90.2% |