Immigrants from Bangladesh vs Fijian 7th Grade
COMPARE
Immigrants from Bangladesh
Fijian
7th Grade
7th Grade Comparison
Immigrants from Bangladesh
Fijians
94.0%
7TH GRADE
0.0/ 100
METRIC RATING
313th/ 347
METRIC RANK
94.7%
7TH GRADE
0.0/ 100
METRIC RATING
293rd/ 347
METRIC RANK
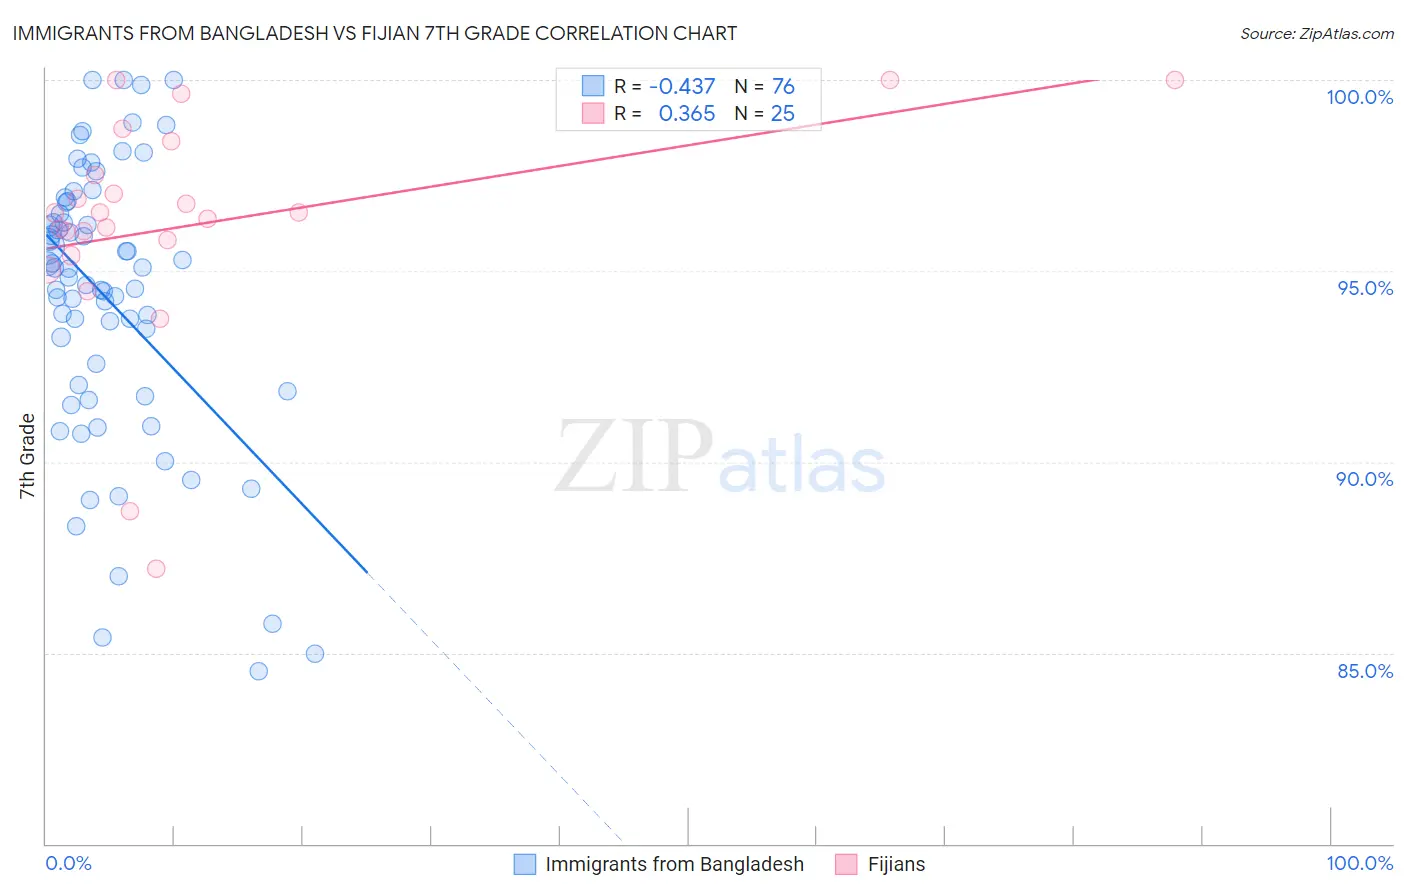
Immigrants from Bangladesh vs Fijian 7th Grade Correlation Chart
The statistical analysis conducted on geographies consisting of 203,672,706 people shows a moderate negative correlation between the proportion of Immigrants from Bangladesh and percentage of population with at least 7th grade education in the United States with a correlation coefficient (R) of -0.437 and weighted average of 94.0%. Similarly, the statistical analysis conducted on geographies consisting of 55,948,842 people shows a mild positive correlation between the proportion of Fijians and percentage of population with at least 7th grade education in the United States with a correlation coefficient (R) of 0.365 and weighted average of 94.7%, a difference of 0.80%.
7th Grade Correlation Summary
| Measurement | Immigrants from Bangladesh | Fijian |
| Minimum | 84.5% | 87.2% |
| Maximum | 100.0% | 100.0% |
| Range | 15.5% | 12.8% |
| Mean | 94.3% | 96.2% |
| Median | 94.9% | 96.5% |
| Interquartile 25% (IQ1) | 91.9% | 95.6% |
| Interquartile 75% (IQ3) | 96.6% | 97.9% |
| Interquartile Range (IQR) | 4.7% | 2.3% |
| Standard Deviation (Sample) | 3.6% | 3.0% |
| Standard Deviation (Population) | 3.6% | 3.0% |
Demographics Similar to Immigrants from Bangladesh and Fijians by 7th Grade
In terms of 7th grade, the demographic groups most similar to Immigrants from Bangladesh are Immigrants (94.0%, a difference of 0.0%), Puerto Rican (94.0%, a difference of 0.040%), Immigrants from Caribbean (94.0%, a difference of 0.050%), Ecuadorian (94.0%, a difference of 0.070%), and Cape Verdean (94.1%, a difference of 0.13%). Similarly, the demographic groups most similar to Fijians are Haitian (94.7%, a difference of 0.080%), Yaqui (94.6%, a difference of 0.11%), Cuban (94.6%, a difference of 0.12%), Immigrants from South Eastern Asia (94.5%, a difference of 0.23%), and Indonesian (94.5%, a difference of 0.23%).
| Demographics | Rating | Rank | 7th Grade |
| Fijians | 0.0 /100 | #293 | Tragic 94.7% |
| Haitians | 0.0 /100 | #294 | Tragic 94.7% |
| Yaqui | 0.0 /100 | #295 | Tragic 94.6% |
| Cubans | 0.0 /100 | #296 | Tragic 94.6% |
| Immigrants | South Eastern Asia | 0.0 /100 | #297 | Tragic 94.5% |
| Indonesians | 0.0 /100 | #298 | Tragic 94.5% |
| Bangladeshis | 0.0 /100 | #299 | Tragic 94.5% |
| Immigrants | Burma/Myanmar | 0.0 /100 | #300 | Tragic 94.5% |
| Immigrants | Dominica | 0.0 /100 | #301 | Tragic 94.5% |
| Immigrants | Laos | 0.0 /100 | #302 | Tragic 94.5% |
| Sri Lankans | 0.0 /100 | #303 | Tragic 94.4% |
| Immigrants | Haiti | 0.0 /100 | #304 | Tragic 94.3% |
| Guyanese | 0.0 /100 | #305 | Tragic 94.3% |
| Immigrants | Guyana | 0.0 /100 | #306 | Tragic 94.2% |
| Immigrants | Portugal | 0.0 /100 | #307 | Tragic 94.2% |
| Cape Verdeans | 0.0 /100 | #308 | Tragic 94.1% |
| Ecuadorians | 0.0 /100 | #309 | Tragic 94.0% |
| Immigrants | Caribbean | 0.0 /100 | #310 | Tragic 94.0% |
| Puerto Ricans | 0.0 /100 | #311 | Tragic 94.0% |
| Immigrants | Immigrants | 0.0 /100 | #312 | Tragic 94.0% |
| Immigrants | Bangladesh | 0.0 /100 | #313 | Tragic 94.0% |